 23
23peptides
spectra
0.000 | 0.000
0.094 | 0.101
0.279 | 0.289
0.000 | 0.000
0.111 | 0.122
0.447 | 0.459
0.044 | 0.049
0.000 | 0.000
| Plot | Mito | Lyso | Perox | ER | Golgi | PM | Cytosol | Nucleus | |||||
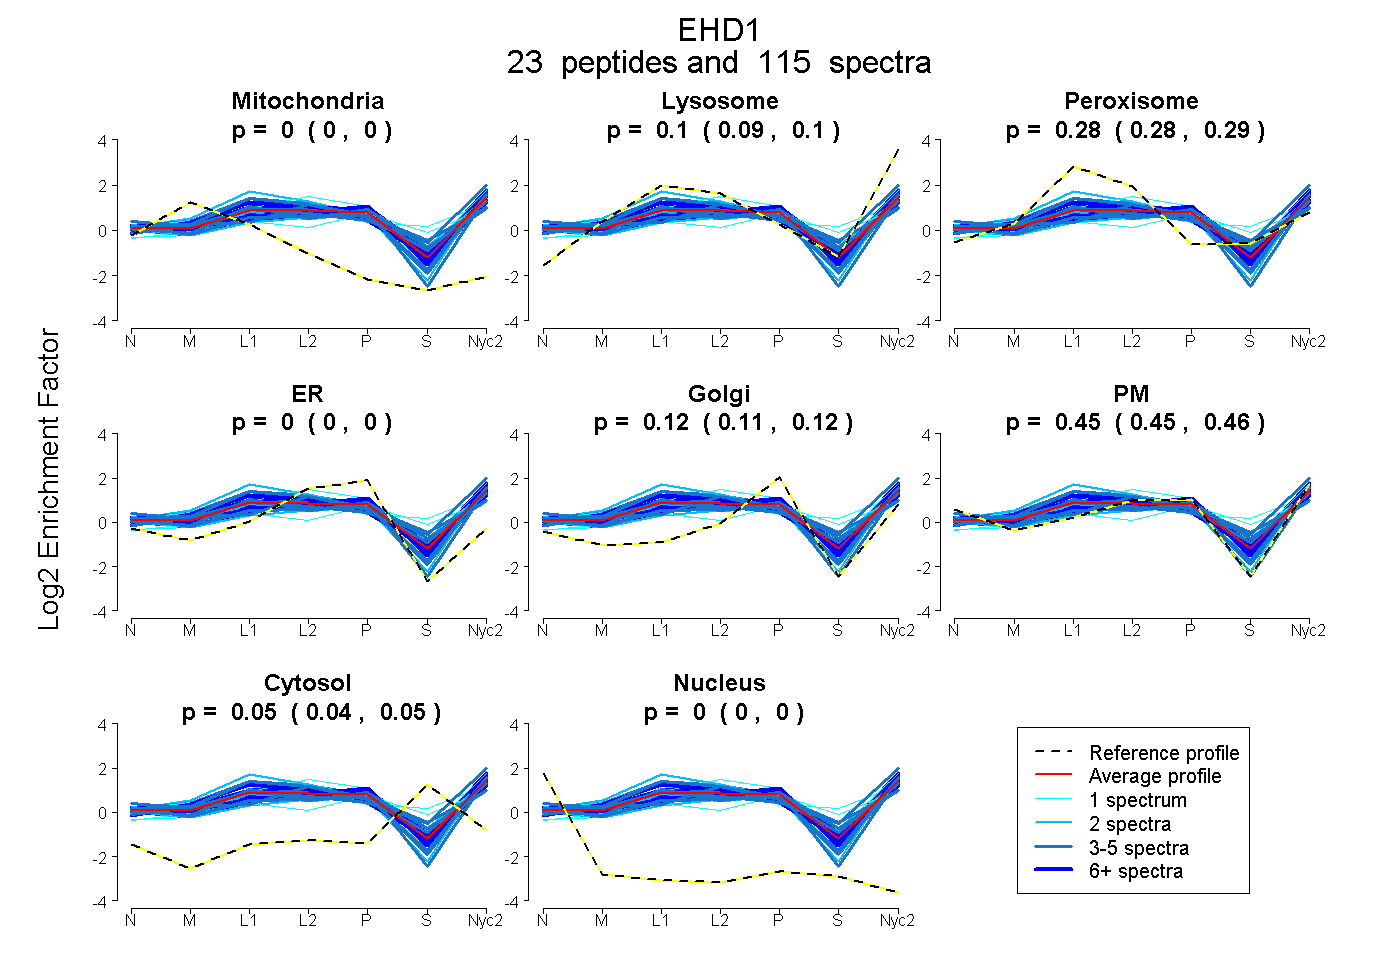
| Expt A |
23 peptides |
115 spectra |
|
0.000 0.000 | 0.000 |
0.098 0.094 | 0.101 |
0.285 0.279 | 0.289 |
0.000 0.000 | 0.000 |
0.117 0.111 | 0.122 |
0.454 0.447 | 0.459 |
0.047 0.044 | 0.049 |
0.000 0.000 | 0.000 |
| 18 spectra, LMVMVR | 0.003 | 0.115 | 0.388 | 0.000 | 0.207 | 0.287 | 0.000 | 0.000 | ||
| 3 spectra, VYGALMWSLGK | 0.000 | 0.341 | 0.157 | 0.000 | 0.000 | 0.357 | 0.146 | 0.000 | ||
| 1 spectrum, LLDTVDDMLANDIAR | 0.000 | 0.242 | 0.194 | 0.083 | 0.000 | 0.430 | 0.052 | 0.000 | ||
| 8 spectra, IINTPEVVR | 0.000 | 0.173 | 0.260 | 0.000 | 0.000 | 0.514 | 0.053 | 0.000 | ||
| 1 spectrum, EHQISSGDFPSLR | 0.000 | 0.192 | 0.390 | 0.000 | 0.046 | 0.148 | 0.225 | 0.000 | ||
| 4 spectra, VYIGSFWSHPLLIPDNR | 0.000 | 0.000 | 0.430 | 0.000 | 0.283 | 0.211 | 0.076 | 0.000 | ||
| 10 spectra, LFEAEEQDLFK | 0.000 | 0.078 | 0.242 | 0.000 | 0.230 | 0.349 | 0.101 | 0.000 | ||
| 4 spectra, VHAYIISSLK | 0.000 | 0.091 | 0.224 | 0.000 | 0.000 | 0.558 | 0.126 | 0.000 | ||
| 4 spectra, QEESLMPSQAVK | 0.006 | 0.100 | 0.316 | 0.000 | 0.000 | 0.578 | 0.000 | 0.000 | ||
| 1 spectrum, LPNTVLGK | 0.000 | 0.164 | 0.257 | 0.000 | 0.314 | 0.035 | 0.229 | 0.000 | ||
| 8 spectra, LNAFGNAFLNR | 0.000 | 0.101 | 0.198 | 0.000 | 0.195 | 0.494 | 0.013 | 0.000 | ||
| 2 spectra, LNDLIK | 0.000 | 0.021 | 0.266 | 0.000 | 0.232 | 0.332 | 0.150 | 0.000 | ||
| 12 spectra, IILLFDAHK | 0.000 | 0.141 | 0.161 | 0.000 | 0.069 | 0.556 | 0.073 | 0.000 | ||
| 4 spectra, EPELFQTVAEGLR | 0.024 | 0.145 | 0.247 | 0.000 | 0.000 | 0.584 | 0.000 | 0.000 | ||
| 2 spectra, LDISDEFSEVIK | 0.000 | 0.089 | 0.227 | 0.000 | 0.023 | 0.513 | 0.147 | 0.000 | ||
| 5 spectra, DIQSLPR | 0.000 | 0.059 | 0.271 | 0.000 | 0.255 | 0.415 | 0.000 | 0.000 | ||
| 3 spectra, ELVNNLGEIYQK | 0.004 | 0.073 | 0.311 | 0.000 | 0.000 | 0.612 | 0.000 | 0.000 | ||
| 2 spectra, EMPNVFGK | 0.016 | 0.196 | 0.250 | 0.000 | 0.000 | 0.539 | 0.000 | 0.000 | ||
| 3 spectra, MQELLQTQDFSK | 0.000 | 0.016 | 0.288 | 0.000 | 0.068 | 0.438 | 0.190 | 0.000 | ||
| 1 spectrum, GYDFAAVLEWFAER | 0.000 | 0.069 | 0.265 | 0.000 | 0.126 | 0.468 | 0.072 | 0.000 | ||
| 1 spectrum, HLIEQDFPGMR | 0.052 | 0.142 | 0.253 | 0.000 | 0.000 | 0.553 | 0.000 | 0.000 | ||
| 14 spectra, ADQIETQQLMR | 0.000 | 0.141 | 0.220 | 0.000 | 0.125 | 0.441 | 0.074 | 0.000 | ||
| 4 spectra, LLPLEEHYR | 0.044 | 0.050 | 0.102 | 0.002 | 0.000 | 0.802 | 0.000 | 0.000 |
| Plot | Mito | Lyso or Perox | ER | Golgi | PM | Cytosol | Nucleus | ||||||
| Expt B |
13 peptides |
53 spectra |
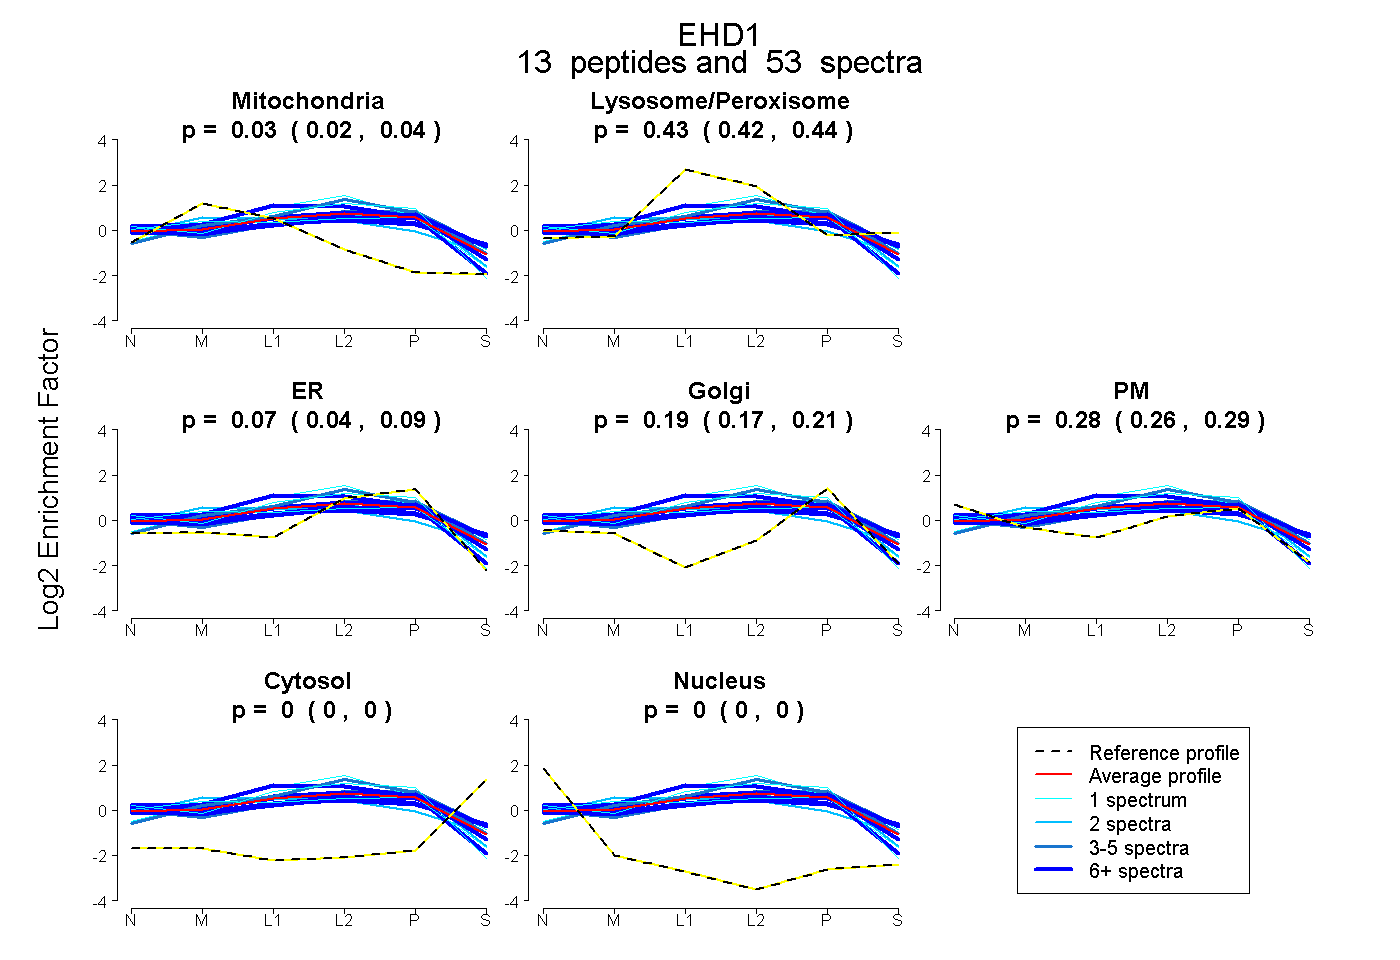 |
0.029 0.022 | 0.036 |
0.432 0.419 | 0.443 |
0.069 0.043 | 0.089 |
0.195 0.172 | 0.212 |
0.275 0.261 | 0.287 |
0.000 0.000 | 0.000 |
0.000 0.000 | 0.000 |
|||
| Plot | Lyso | Other | |||||||||||
| Expt C |
15 peptides |
130 spectra |
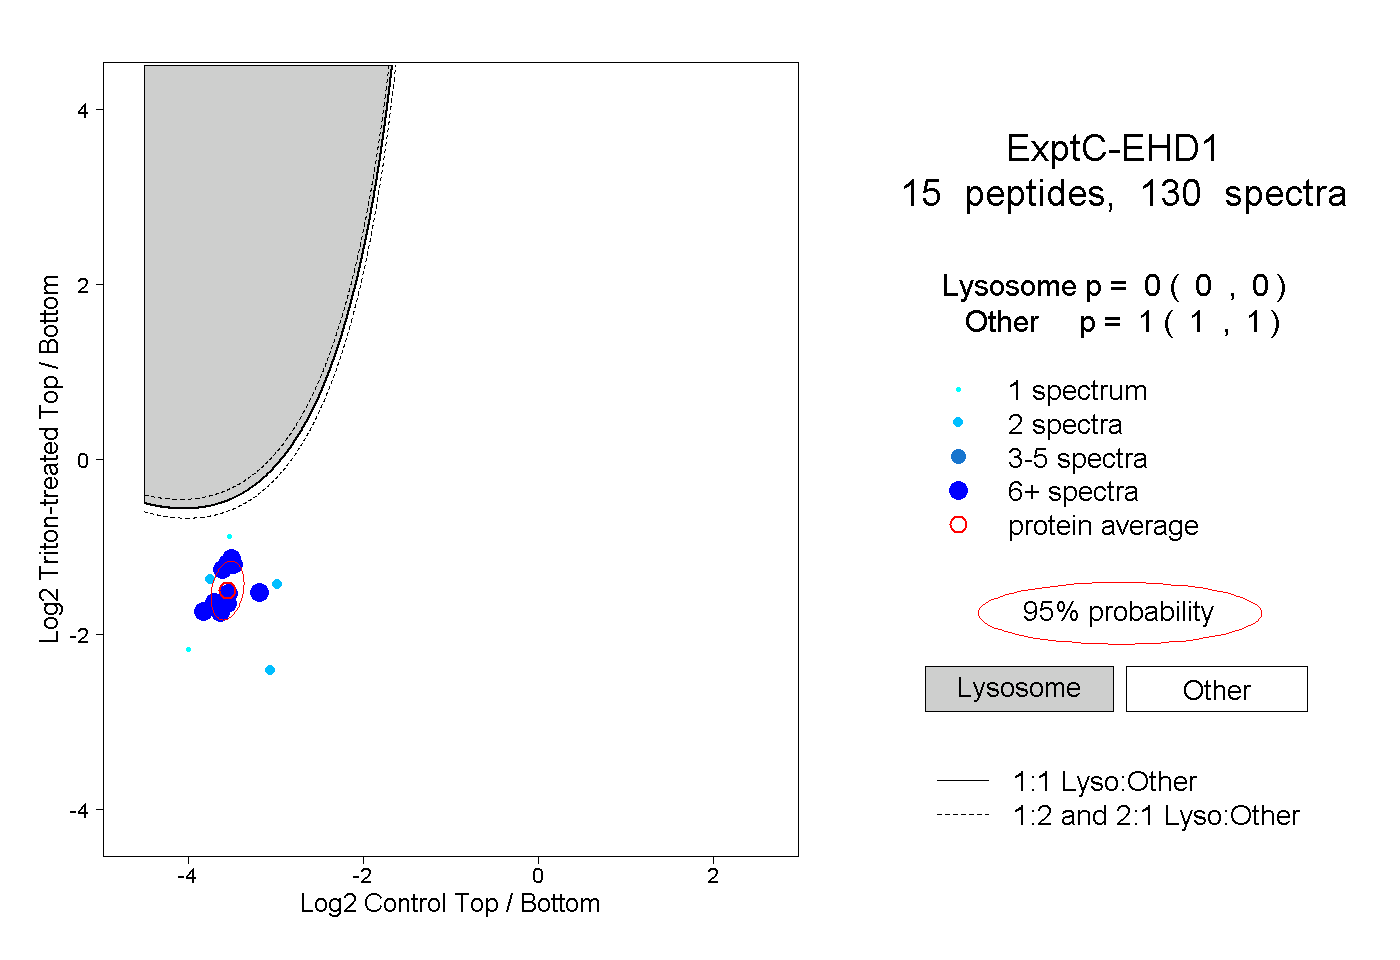 |
0.000 0.000 | 0.000 |
1.000 1.000 | 1.000 |
||||||||
| Plot | Lyso | Other | |||||||||||
| Expt D |
4 peptides |
6 spectra |
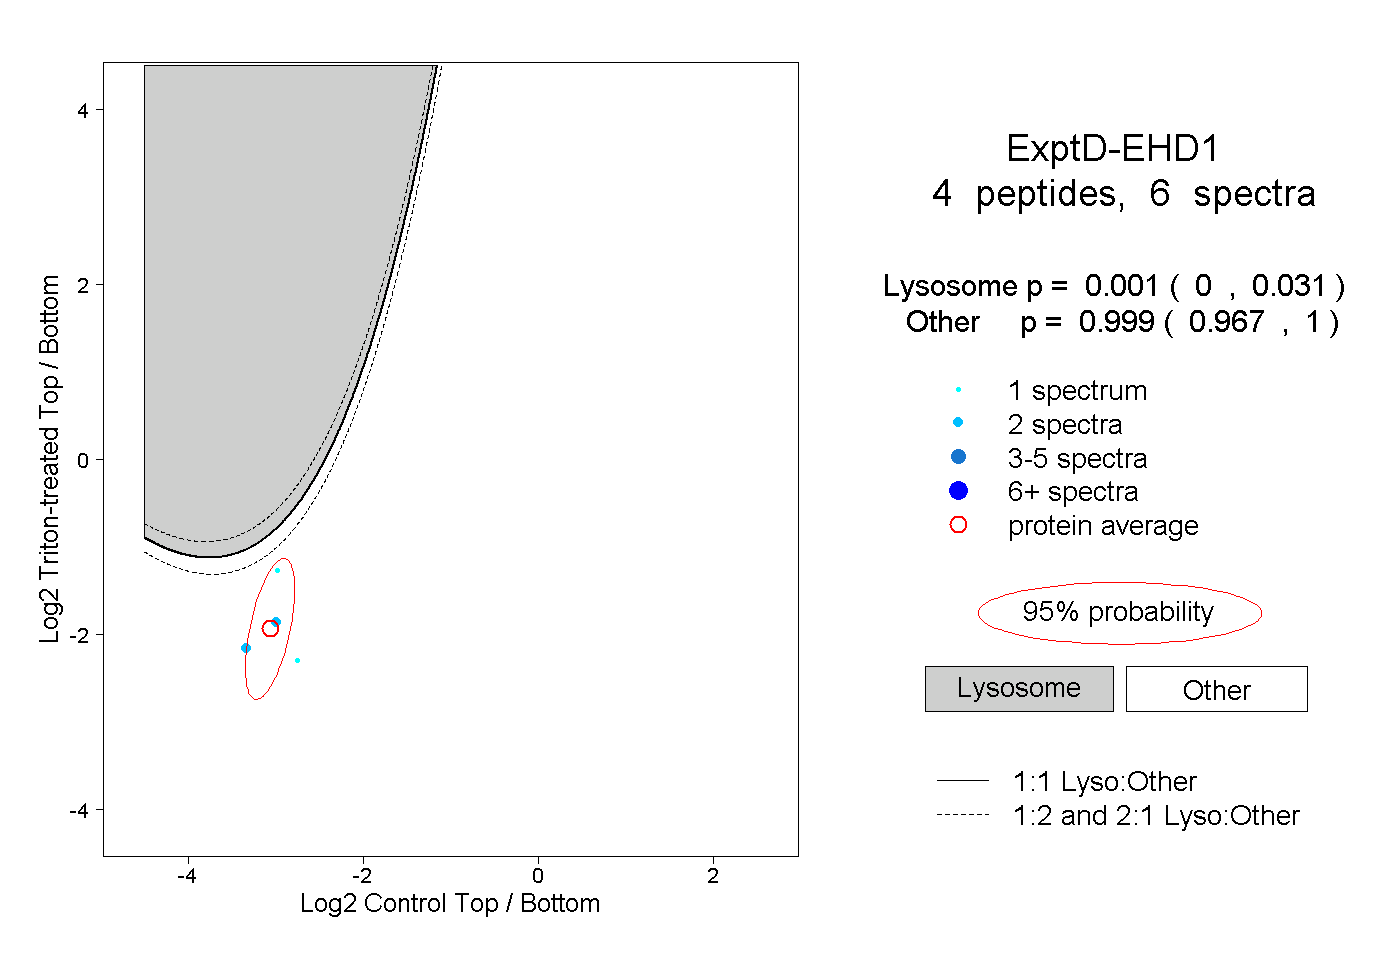 |
0.001 0.000 | 0.031 |
0.999 0.967 | 1.000 |