 9
9peptides
spectra
0.954 | 0.959
0.000 | 0.000
0.000 | 0.000
0.000 | 0.000
0.000 | 0.000
0.000 | 0.000
0.000 | 0.000
0.041 | 0.045
| Plot | Mito | Lyso | Perox | ER | Golgi | PM | Cytosol | Nucleus | |||||
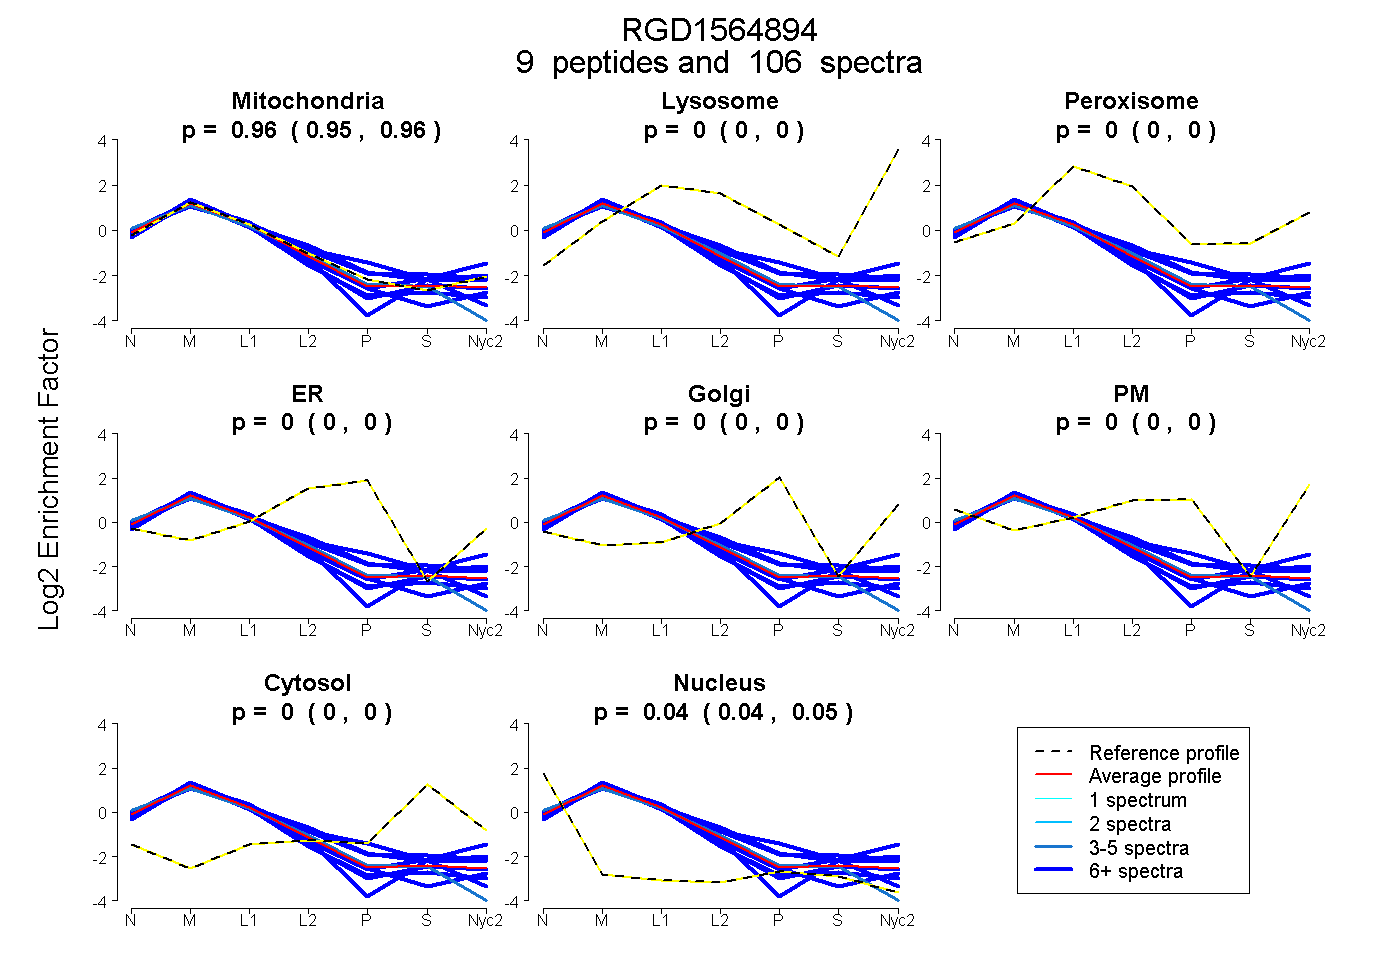
| Expt A |
9 peptides |
106 spectra |
|
0.957 0.954 | 0.959 |
0.000 0.000 | 0.000 |
0.000 0.000 | 0.000 |
0.000 0.000 | 0.000 |
0.000 0.000 | 0.000 |
0.000 0.000 | 0.000 |
0.000 0.000 | 0.000 |
0.043 0.041 | 0.045 |
| 4 spectra, YLPESLK | 0.877 | 0.000 | 0.000 | 0.000 | 0.000 | 0.000 | 0.000 | 0.123 | ||
| 14 spectra, GYPVYNHTEK | 0.844 | 0.000 | 0.017 | 0.105 | 0.000 | 0.000 | 0.035 | 0.000 | ||
| 6 spectra, AQGLISHIIYAQTLVMDK | 0.898 | 0.000 | 0.025 | 0.042 | 0.000 | 0.000 | 0.035 | 0.000 | ||
| 31 spectra, SSQMLQMLESSLR | 0.945 | 0.000 | 0.000 | 0.000 | 0.000 | 0.000 | 0.000 | 0.055 | ||
| 15 spectra, MAGTVPDYR | 0.914 | 0.018 | 0.000 | 0.000 | 0.000 | 0.000 | 0.069 | 0.000 | ||
| 6 spectra, QCLAFLGTPDVINWK | 0.916 | 0.000 | 0.000 | 0.000 | 0.000 | 0.000 | 0.000 | 0.084 | ||
| 15 spectra, VYGTVFHMNQGNPFK | 0.963 | 0.000 | 0.000 | 0.000 | 0.000 | 0.000 | 0.000 | 0.037 | ||
| 6 spectra, LVPFLLEDTENLDR | 0.906 | 0.000 | 0.000 | 0.000 | 0.000 | 0.000 | 0.000 | 0.094 | ||
| 9 spectra, TQCILYMMPETAK | 0.851 | 0.000 | 0.070 | 0.000 | 0.000 | 0.000 | 0.049 | 0.030 |
| Plot | Mito | Lyso or Perox | ER | Golgi | PM | Cytosol | Nucleus | ||||||
| Expt B |
9 peptides |
41 spectra |
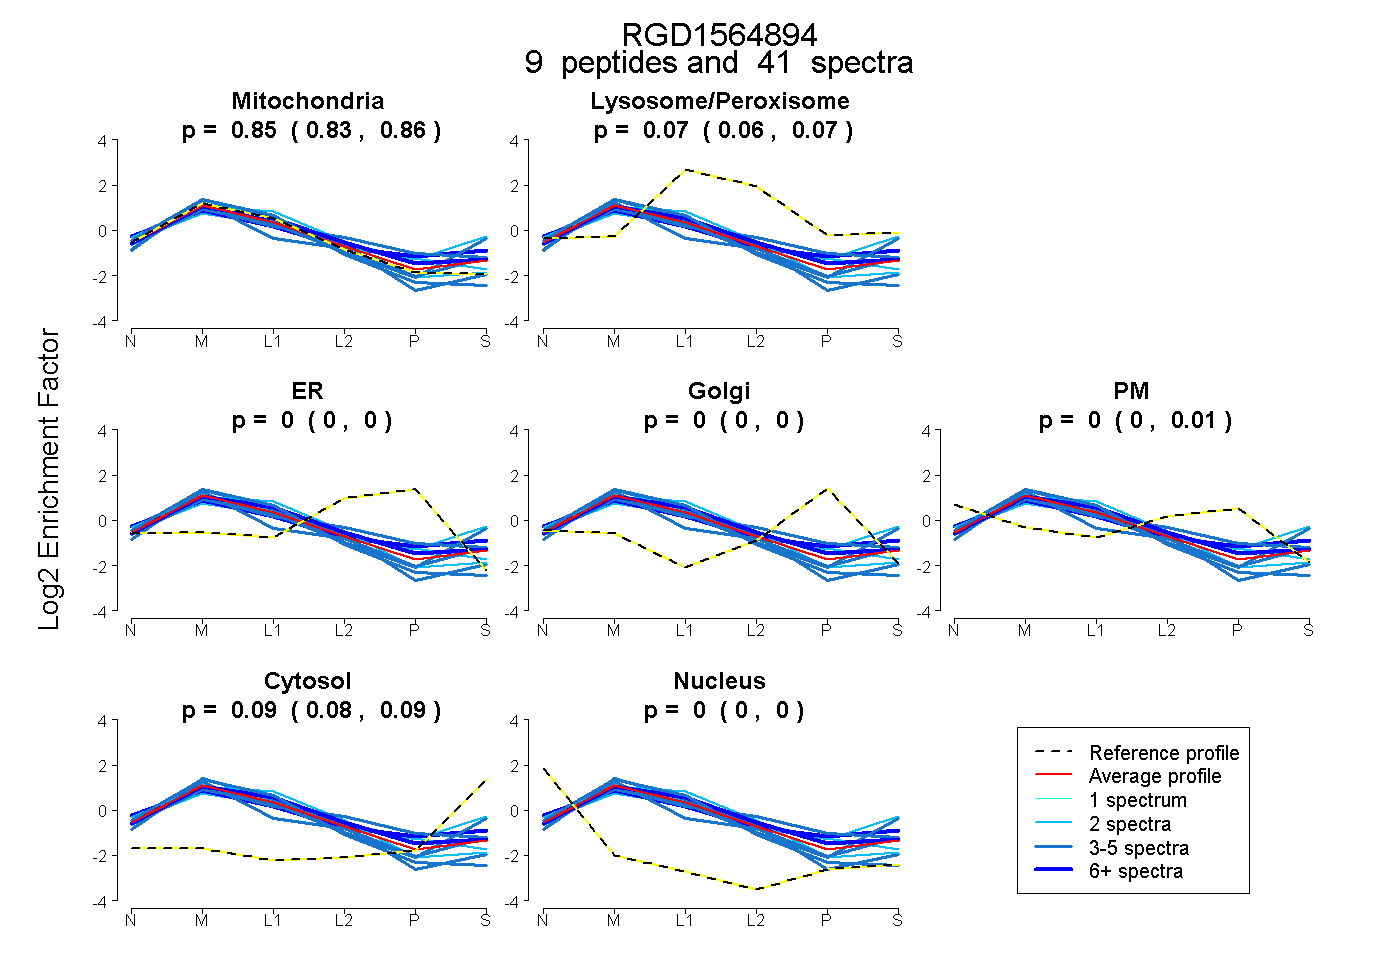 |
0.846 0.831 | 0.859 |
0.065 0.055 | 0.072 |
0.000 0.000 | 0.000 |
0.000 0.000 | 0.000 |
0.000 0.000 | 0.010 |
0.088 0.078 | 0.095 |
0.000 0.000 | 0.000 |
|||
| Plot | Lyso | Other | |||||||||||
| Expt C |
11 peptides |
359 spectra |
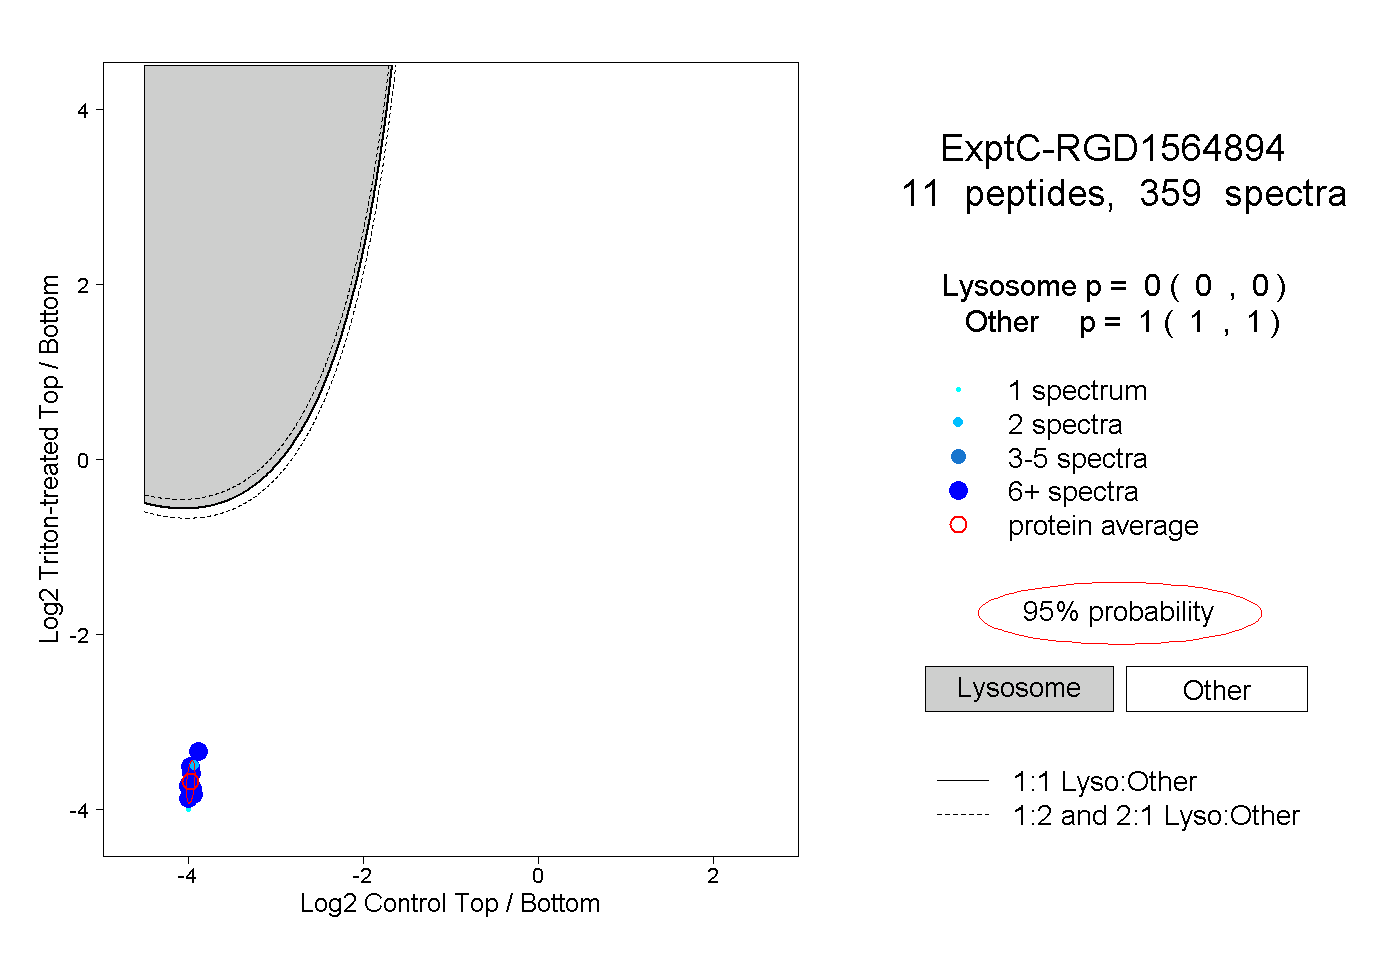 |
0.000 0.000 | 0.000 |
1.000 1.000 | 1.000 |
||||||||
| Plot | Lyso | Other | |||||||||||
| Expt D |
4 peptides |
24 spectra |
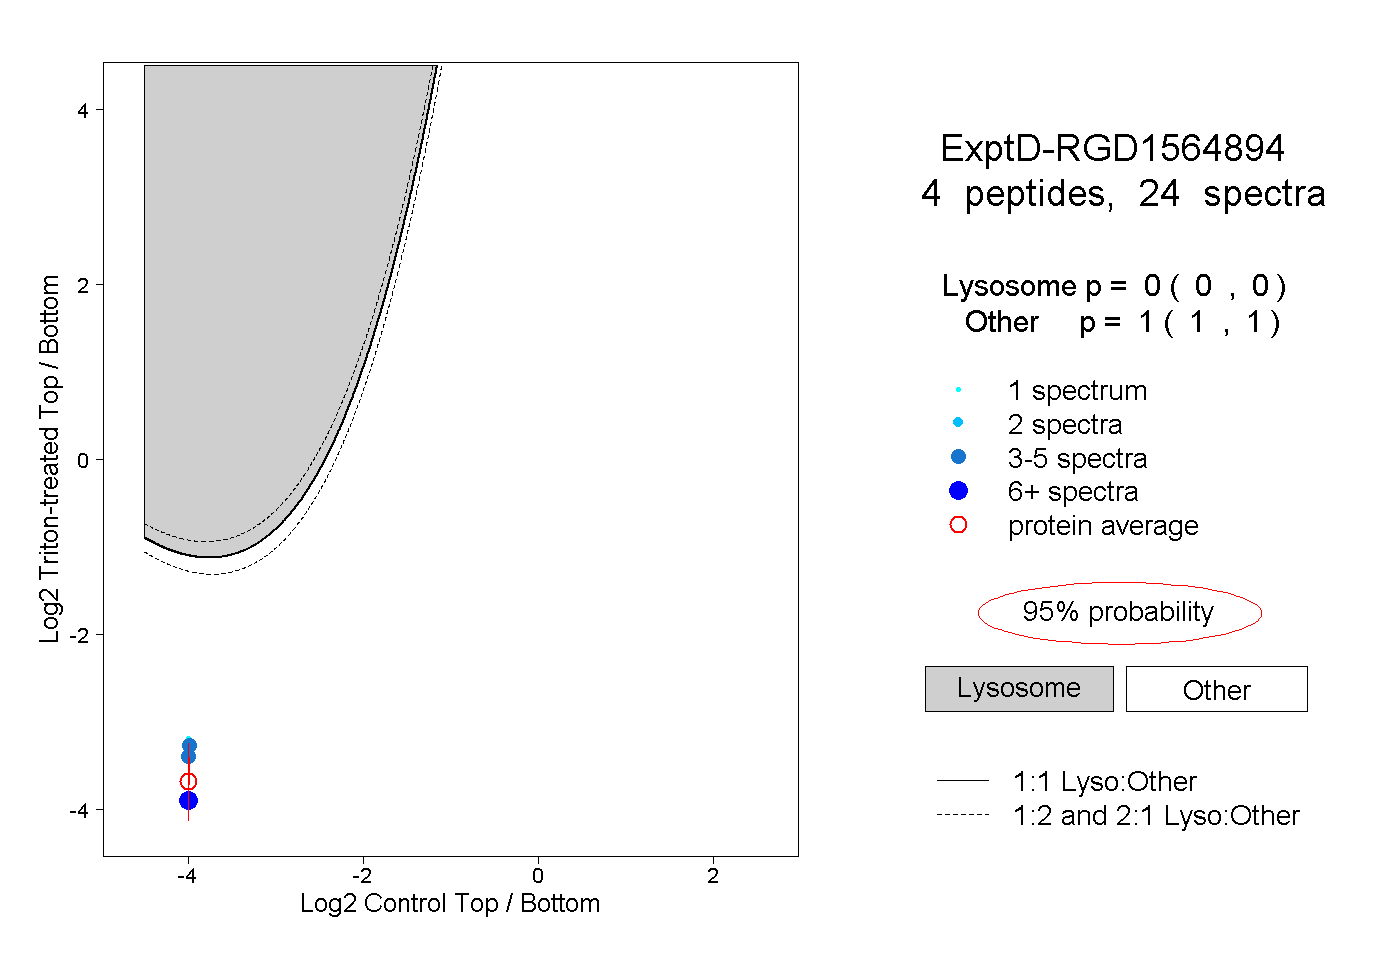 |
0.000 0.000 | 0.000 |
1.000 1.000 | 1.000 |