 3
3peptides
spectra
0.000 | 0.000
0.099 | 0.285
0.000 | 0.099
0.000 | 0.067
0.265 | 0.679
0.031 | 0.342
0.000 | 0.122
0.000 | 0.062
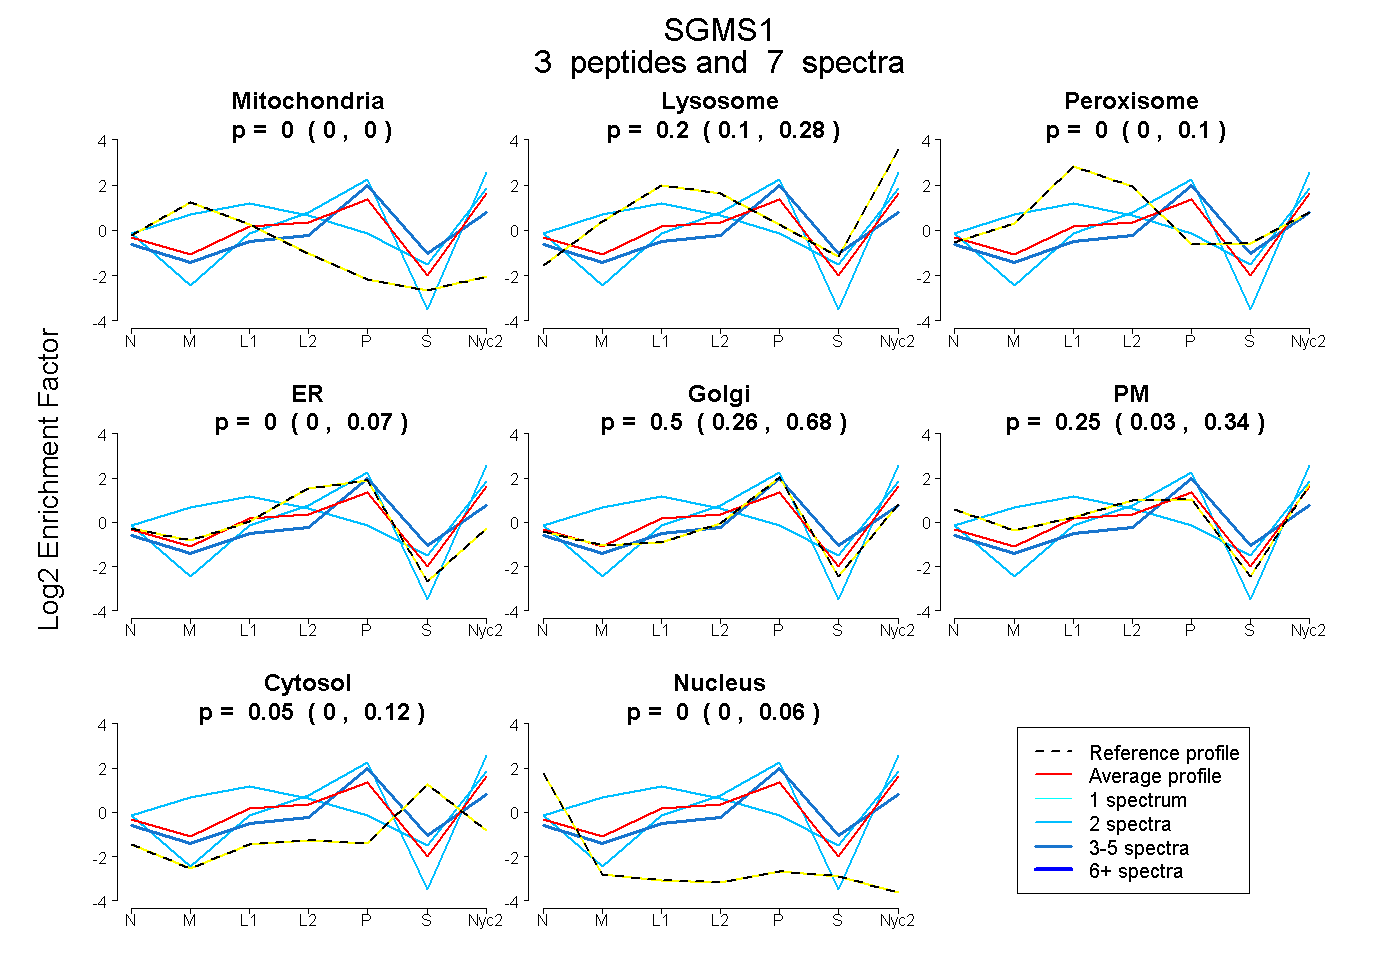
| Plot | Mito | Lyso | Perox | ER | Golgi | PM | Cytosol | Nucleus | |||||
| Expt A |
3 peptides |
7 spectra |
|
0.000 0.000 | 0.000 |
0.197 0.099 | 0.285 |
0.000 0.000 | 0.099 |
0.000 0.000 | 0.067 |
0.501 0.265 | 0.679 |
0.251 0.031 | 0.342 |
0.051 0.000 | 0.122 |
0.000 0.000 | 0.062 |
| 3 spectra, LLDMIETLK | 0.000 | 0.077 | 0.000 | 0.000 | 0.740 | 0.000 | 0.182 | 0.000 | ||
| 2 spectra, LFGDWEAQVR | 0.000 | 0.027 | 0.000 | 0.000 | 0.583 | 0.389 | 0.000 | 0.000 | ||
| 2 spectra, EYSPR | 0.217 | 0.437 | 0.063 | 0.000 | 0.000 | 0.283 | 0.000 | 0.000 |