 3
3peptides
spectra
0.000 | 0.122
0.000 | 0.000
0.000 | 0.306
0.000 | 0.000
0.000 | 0.000
0.099 | 0.420
0.375 | 0.588
0.000 | 0.142
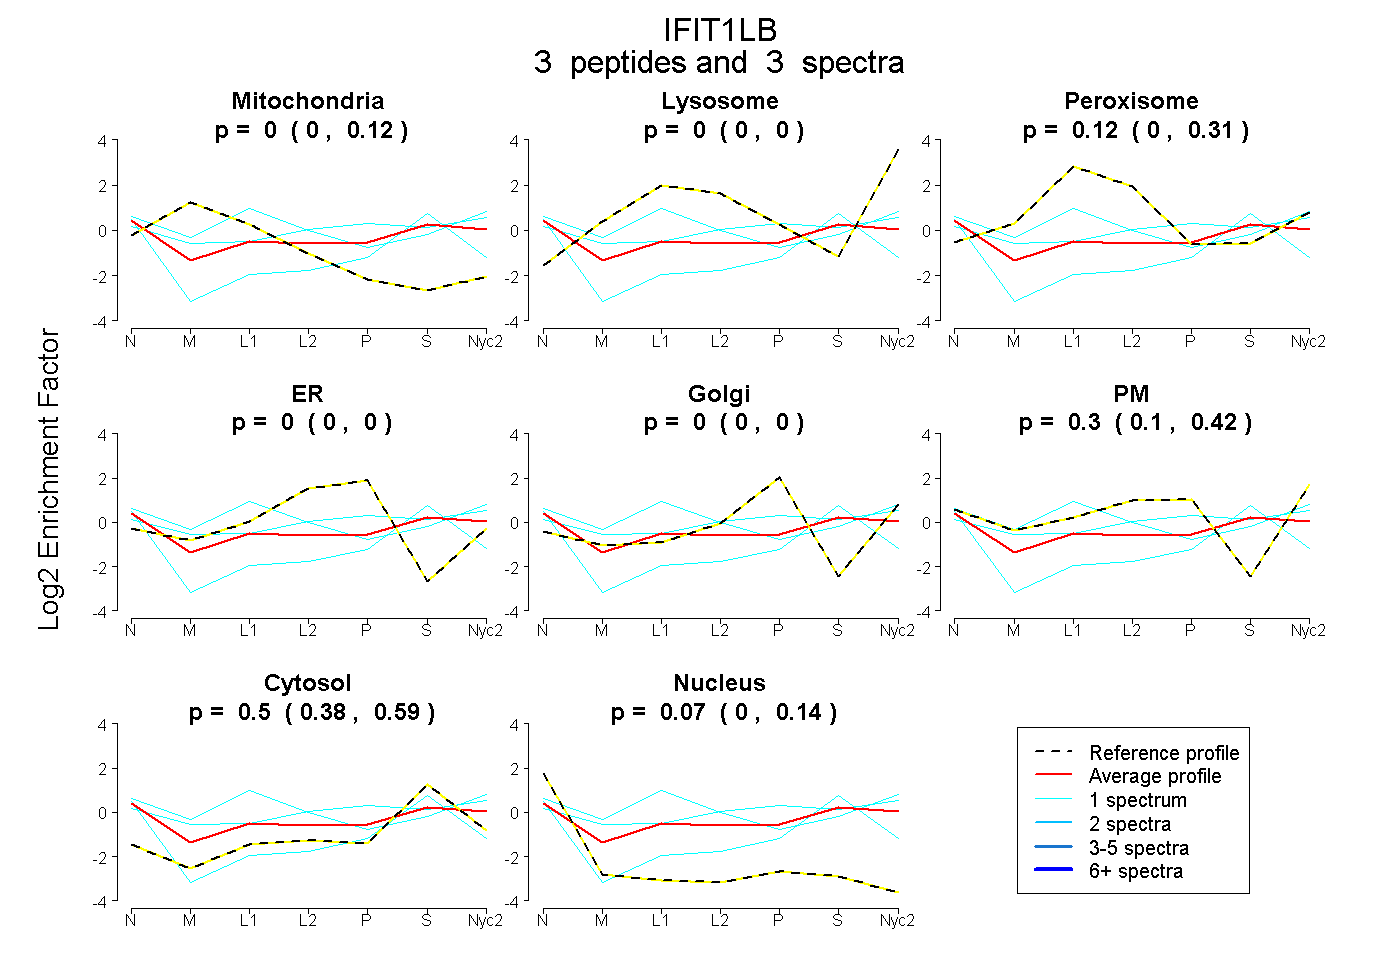
| Plot | Mito | Lyso | Perox | ER | Golgi | PM | Cytosol | Nucleus | |||||
| Expt A |
3 peptides |
3 spectra |
|
0.000 0.000 | 0.122 |
0.000 0.000 | 0.000 |
0.120 0.000 | 0.306 |
0.000 0.000 | 0.000 |
0.000 0.000 | 0.000 |
0.305 0.099 | 0.420 |
0.501 0.375 | 0.588 |
0.075 0.000 | 0.142 |
| 1 spectrum, EFASPFR | 0.000 | 0.045 | 0.464 | 0.000 | 0.000 | 0.191 | 0.204 | 0.096 | ||
| 1 spectrum, GEQEEALQSLK | 0.000 | 0.000 | 0.087 | 0.000 | 0.000 | 0.488 | 0.425 | 0.000 | ||
| 1 spectrum, EAEALIEGEQLGK | 0.000 | 0.000 | 0.000 | 0.000 | 0.000 | 0.022 | 0.727 | 0.252 |