22
22peptides
spectra
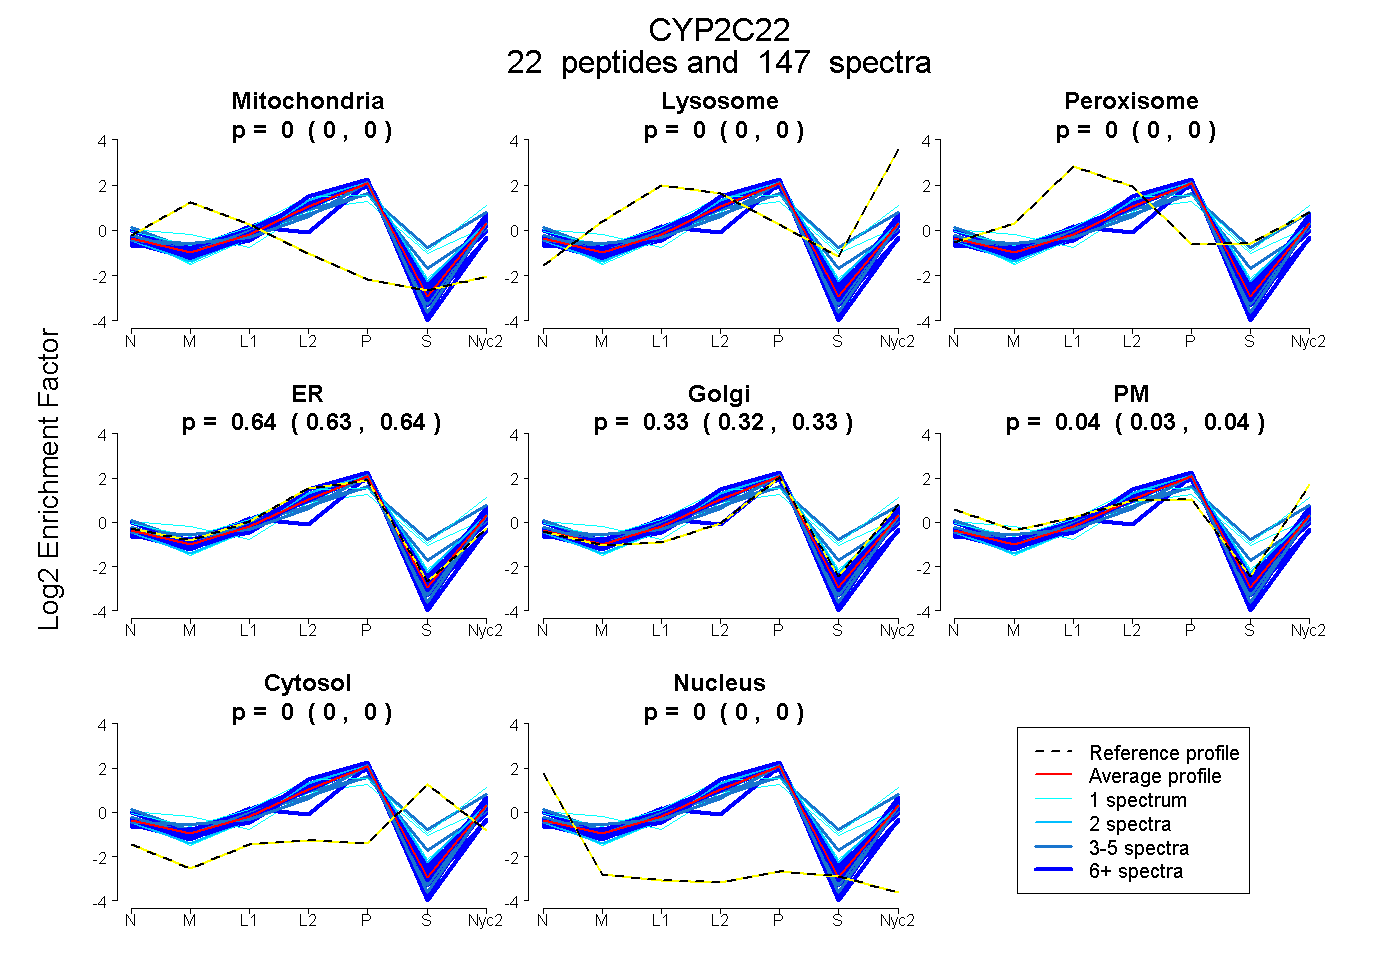
0.000 | 0.000
0.000 | 0.000
0.000 | 0.000
0.632 | 0.642
0.321 | 0.331
0.031 | 0.039
0.000 | 0.000
0.000 | 0.000
16peptides
spectra
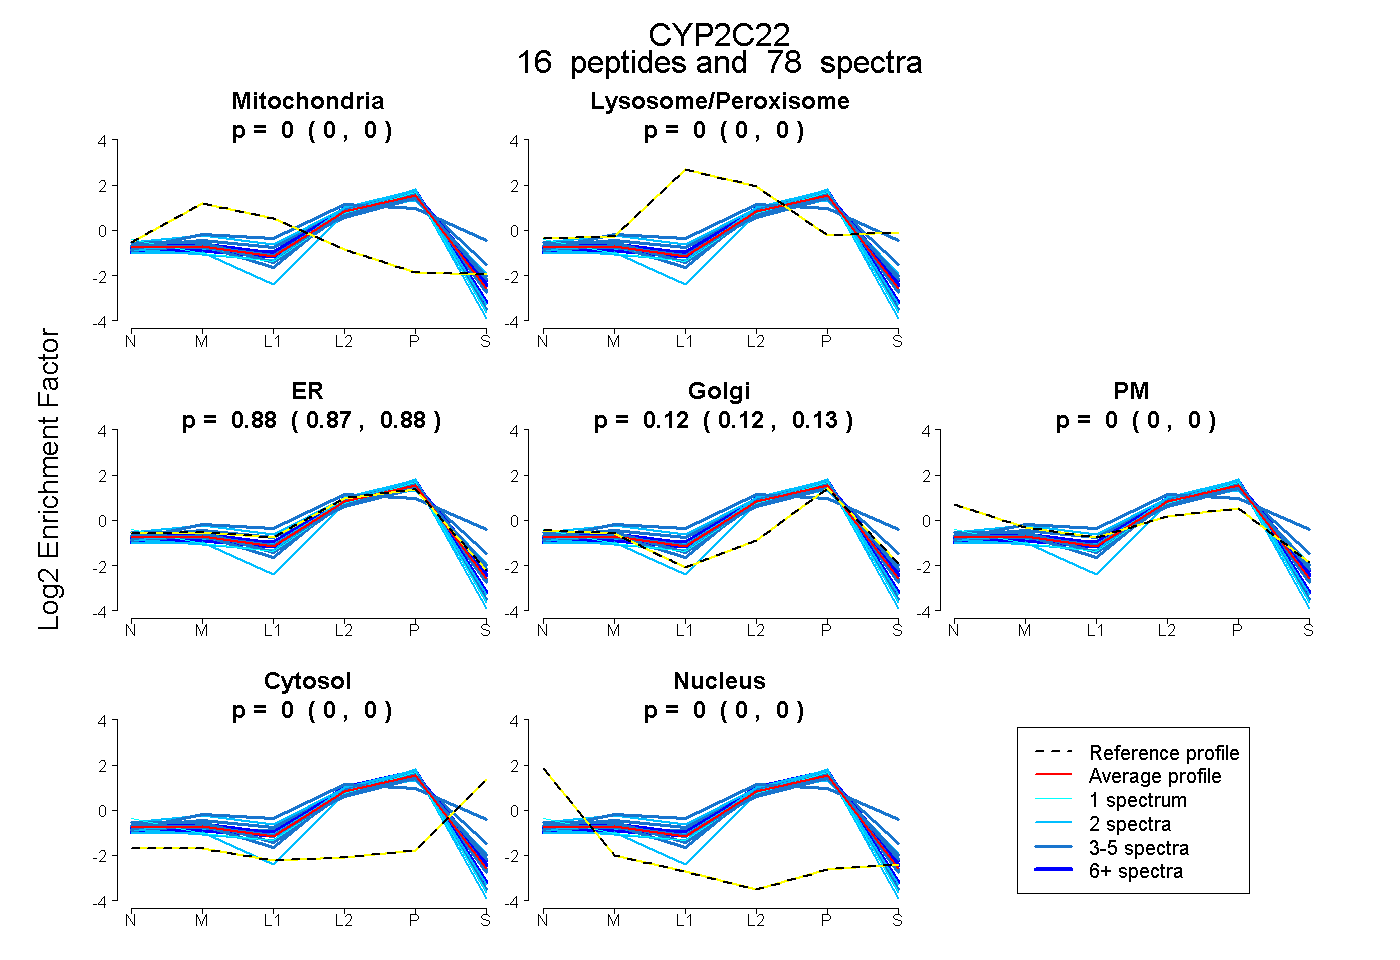
0.000 | 0.000
0.000 | 0.000
0.870 | 0.884
0.115 | 0.129
0.000 | 0.000
0.000 | 0.000
0.000 | 0.000
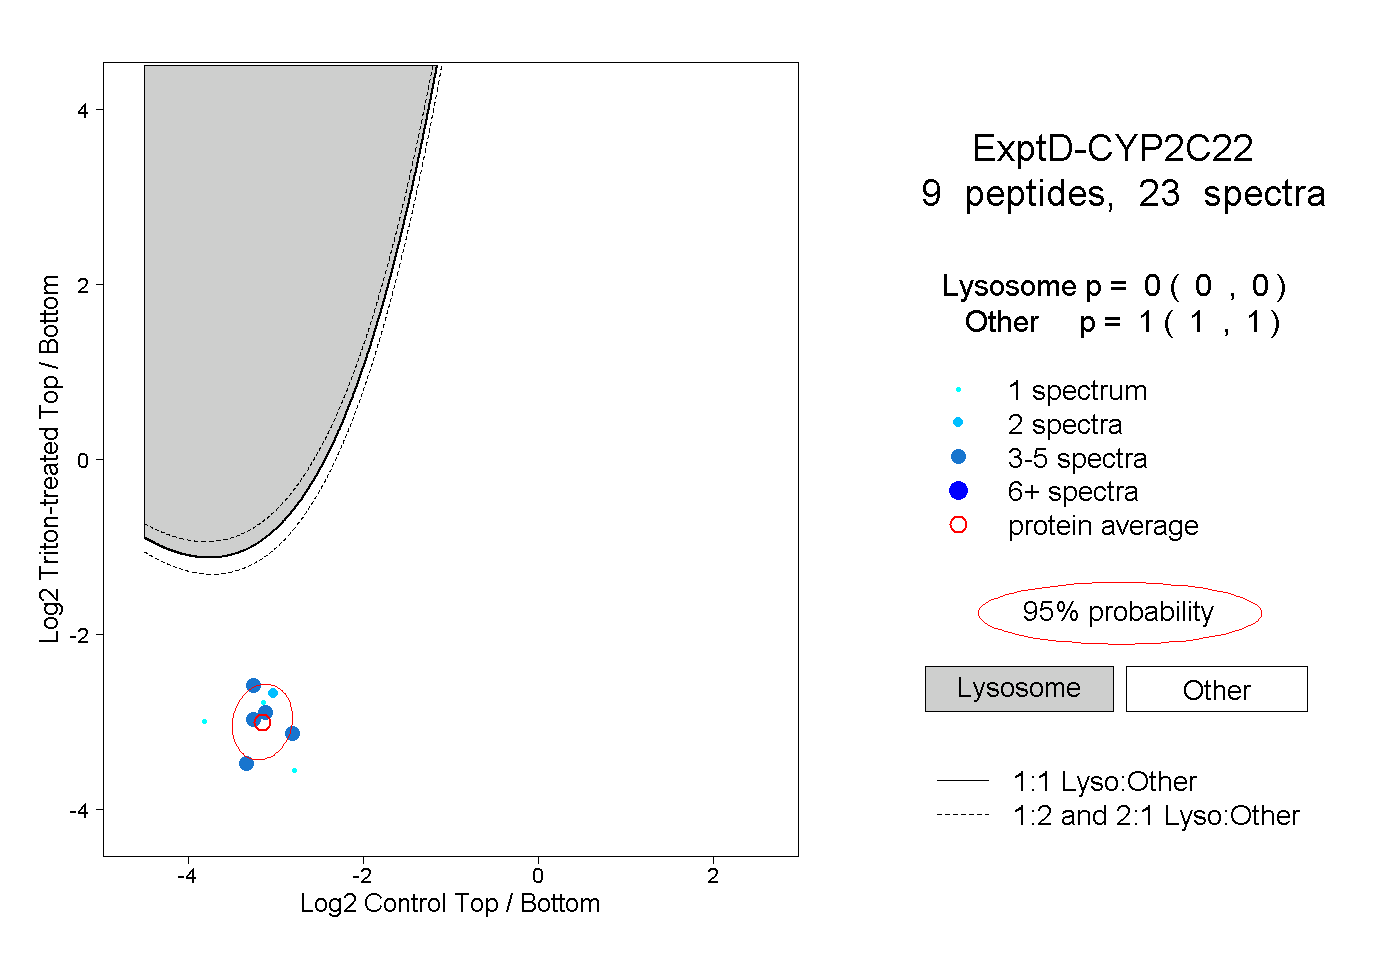
21peptides
spectra
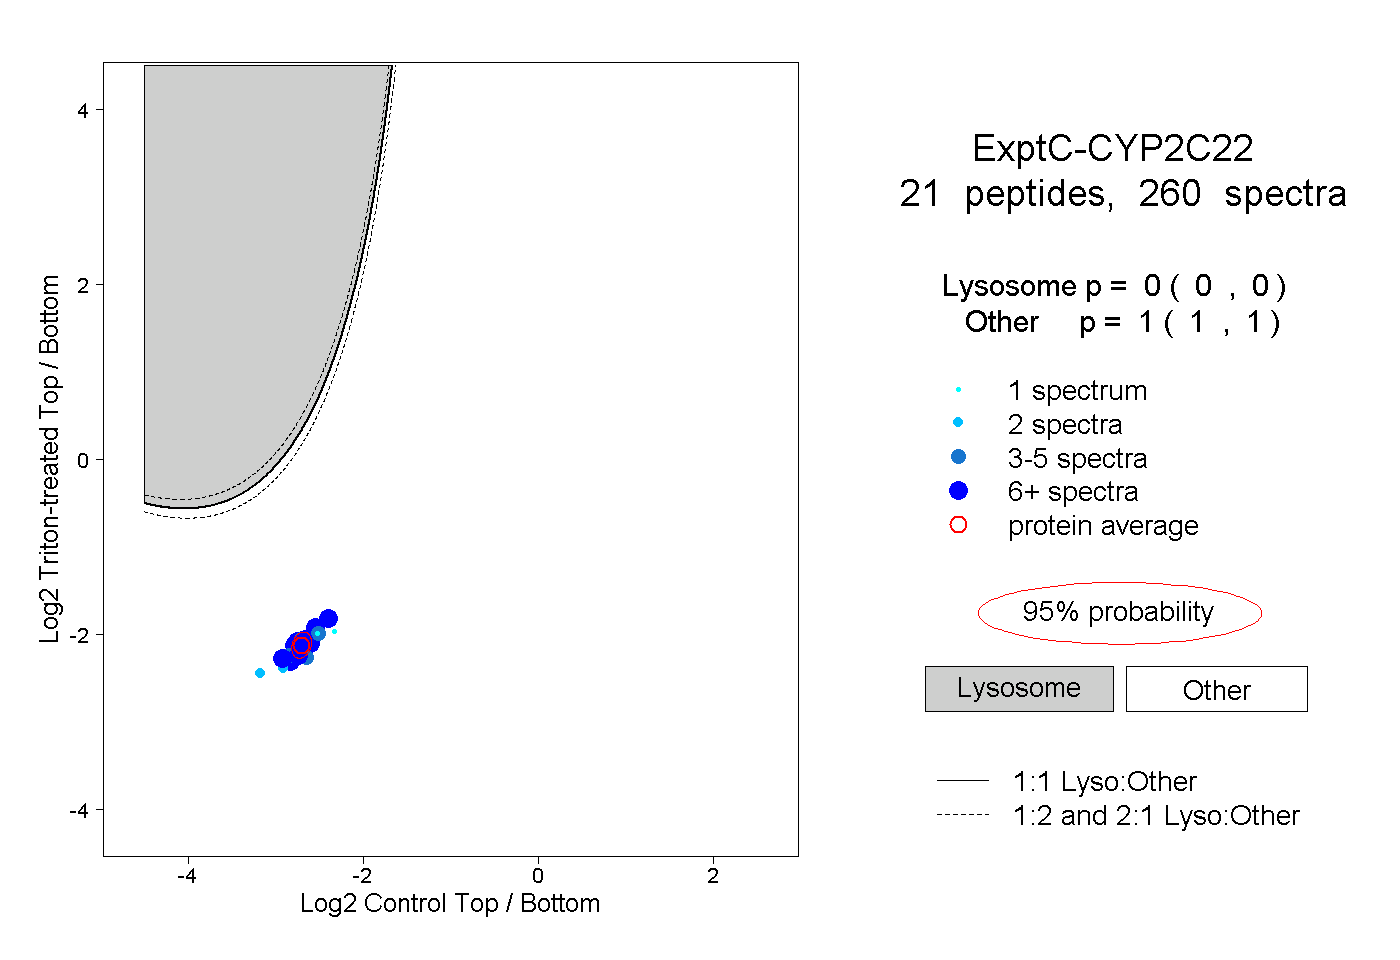
0.000 | 0.000
1.000 | 1.000