 22
22peptides
spectra
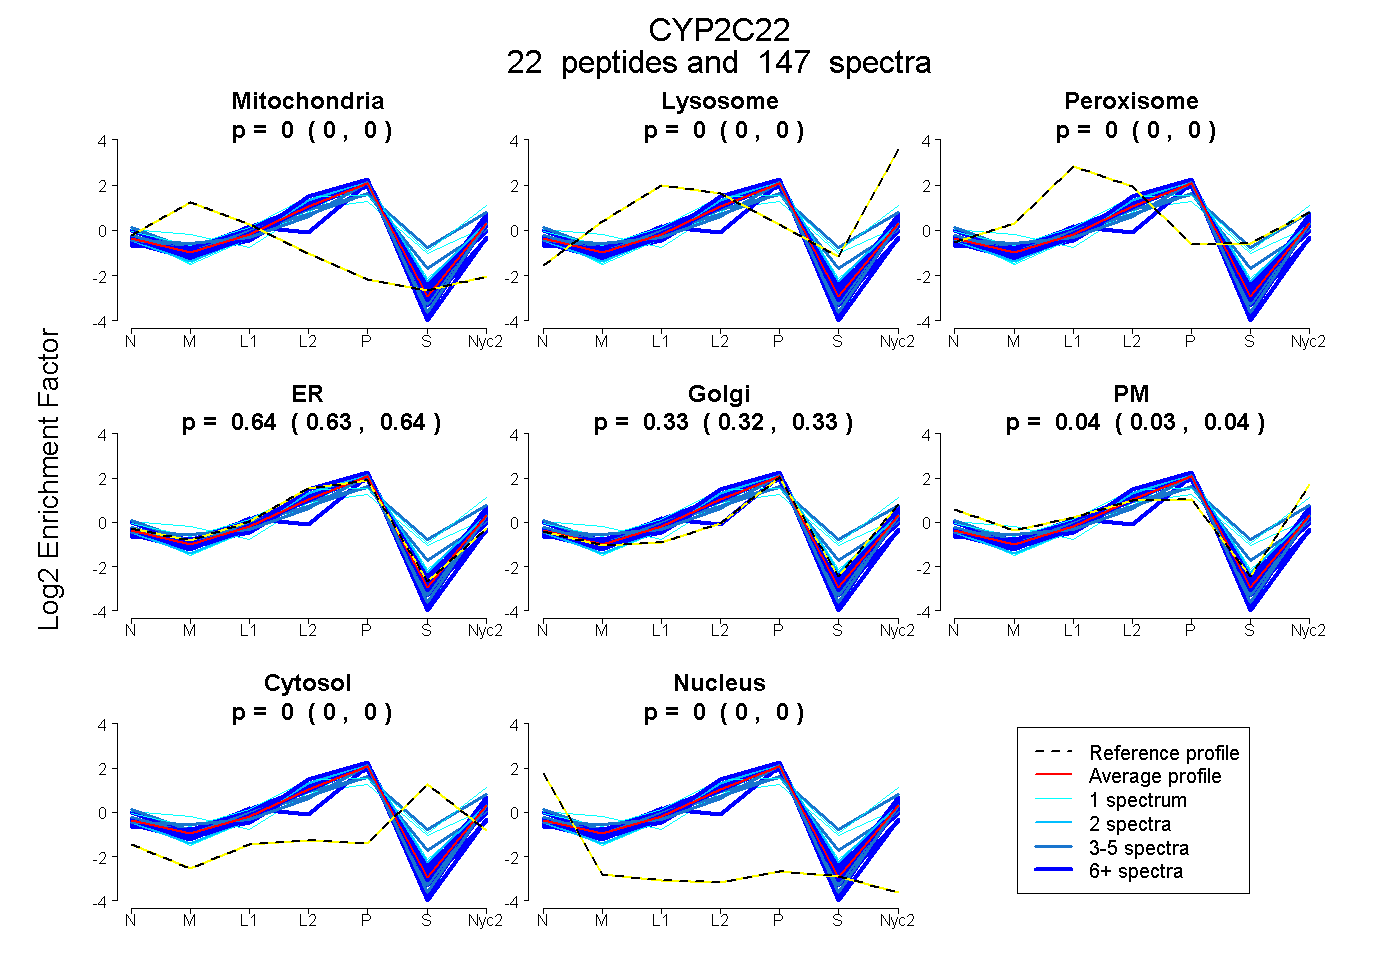
0.000 | 0.000
0.000 | 0.000
0.000 | 0.000
0.632 | 0.642
0.321 | 0.331
0.031 | 0.039
0.000 | 0.000
0.000 | 0.000
| Plot | Mito | Lyso | Perox | ER | Golgi | PM | Cytosol | Nucleus | |||||
| Expt A |
22 peptides |
147 spectra |
|
0.000 0.000 | 0.000 |
0.000 0.000 | 0.000 |
0.000 0.000 | 0.000 |
0.638 0.632 | 0.642 |
0.326 0.321 | 0.331 |
0.036 0.031 | 0.039 |
0.000 0.000 | 0.000 |
0.000 0.000 | 0.000 |
| 10 spectra, FILMEINR | 0.000 | 0.043 | 0.000 | 0.550 | 0.349 | 0.058 | 0.000 | 0.000 | ||
| 7 spectra, FDYSDEK | 0.000 | 0.000 | 0.000 | 0.618 | 0.382 | 0.000 | 0.000 | 0.000 | ||
| 10 spectra, SMCMLAK | 0.000 | 0.000 | 0.000 | 0.920 | 0.080 | 0.000 | 0.000 | 0.000 | ||
| 8 spectra, SDYFMAFSAGR | 0.000 | 0.000 | 0.000 | 0.638 | 0.362 | 0.000 | 0.000 | 0.000 | ||
| 3 spectra, NHMPYTDAVLHEIQR | 0.000 | 0.157 | 0.015 | 0.334 | 0.190 | 0.118 | 0.186 | 0.000 | ||
| 5 spectra, FIENFHTK | 0.000 | 0.000 | 0.000 | 0.704 | 0.269 | 0.027 | 0.000 | 0.000 | ||
| 3 spectra, YPEVTAK | 0.015 | 0.000 | 0.000 | 0.517 | 0.468 | 0.000 | 0.000 | 0.000 | ||
| 5 spectra, RPCMQDR | 0.000 | 0.000 | 0.065 | 0.490 | 0.214 | 0.124 | 0.101 | 0.006 | ||
| 5 spectra, EALLDR | 0.000 | 0.000 | 0.000 | 0.708 | 0.251 | 0.041 | 0.000 | 0.000 | ||
| 16 spectra, FDPGHFLDEK | 0.000 | 0.000 | 0.000 | 0.740 | 0.260 | 0.000 | 0.000 | 0.000 | ||
| 11 spectra, IQEELTR | 0.000 | 0.000 | 0.000 | 0.656 | 0.214 | 0.130 | 0.000 | 0.000 | ||
| 1 spectrum, IQEEVVYLLEALR | 0.000 | 0.000 | 0.000 | 0.418 | 0.025 | 0.341 | 0.216 | 0.000 | ||
| 8 spectra, MHSSMLSK | 0.062 | 0.000 | 0.025 | 0.300 | 0.608 | 0.000 | 0.005 | 0.000 | ||
| 1 spectrum, GYHIPK | 0.000 | 0.000 | 0.000 | 0.509 | 0.491 | 0.000 | 0.000 | 0.000 | ||
| 9 spectra, YIDFVPIPLPR | 0.000 | 0.000 | 0.000 | 0.788 | 0.212 | 0.000 | 0.000 | 0.000 | ||
| 17 spectra, SMGMGK | 0.000 | 0.054 | 0.000 | 0.530 | 0.415 | 0.000 | 0.000 | 0.000 | ||
| 9 spectra, ACIGEGLAR | 0.000 | 0.000 | 0.000 | 0.838 | 0.142 | 0.000 | 0.000 | 0.020 | ||
| 1 spectrum, ASLNLSNPQDFIDYFLIK | 0.000 | 0.004 | 0.000 | 0.659 | 0.290 | 0.000 | 0.047 | 0.000 | ||
| 1 spectrum, VSQGLGIVFSNGEIWK | 0.000 | 0.212 | 0.002 | 0.409 | 0.000 | 0.257 | 0.120 | 0.000 | ||
| 9 spectra, FSLMVLR | 0.000 | 0.020 | 0.000 | 0.615 | 0.280 | 0.086 | 0.000 | 0.000 | ||
| 6 spectra, GEEFSDK | 0.000 | 0.000 | 0.000 | 0.543 | 0.237 | 0.220 | 0.000 | 0.000 | ||
| 2 spectra, TTQDVEFR | 0.000 | 0.021 | 0.000 | 0.639 | 0.325 | 0.000 | 0.015 | 0.000 |
| Plot | Mito | Lyso or Perox | ER | Golgi | PM | Cytosol | Nucleus | ||||||
| Expt B |
16 peptides |
78 spectra |
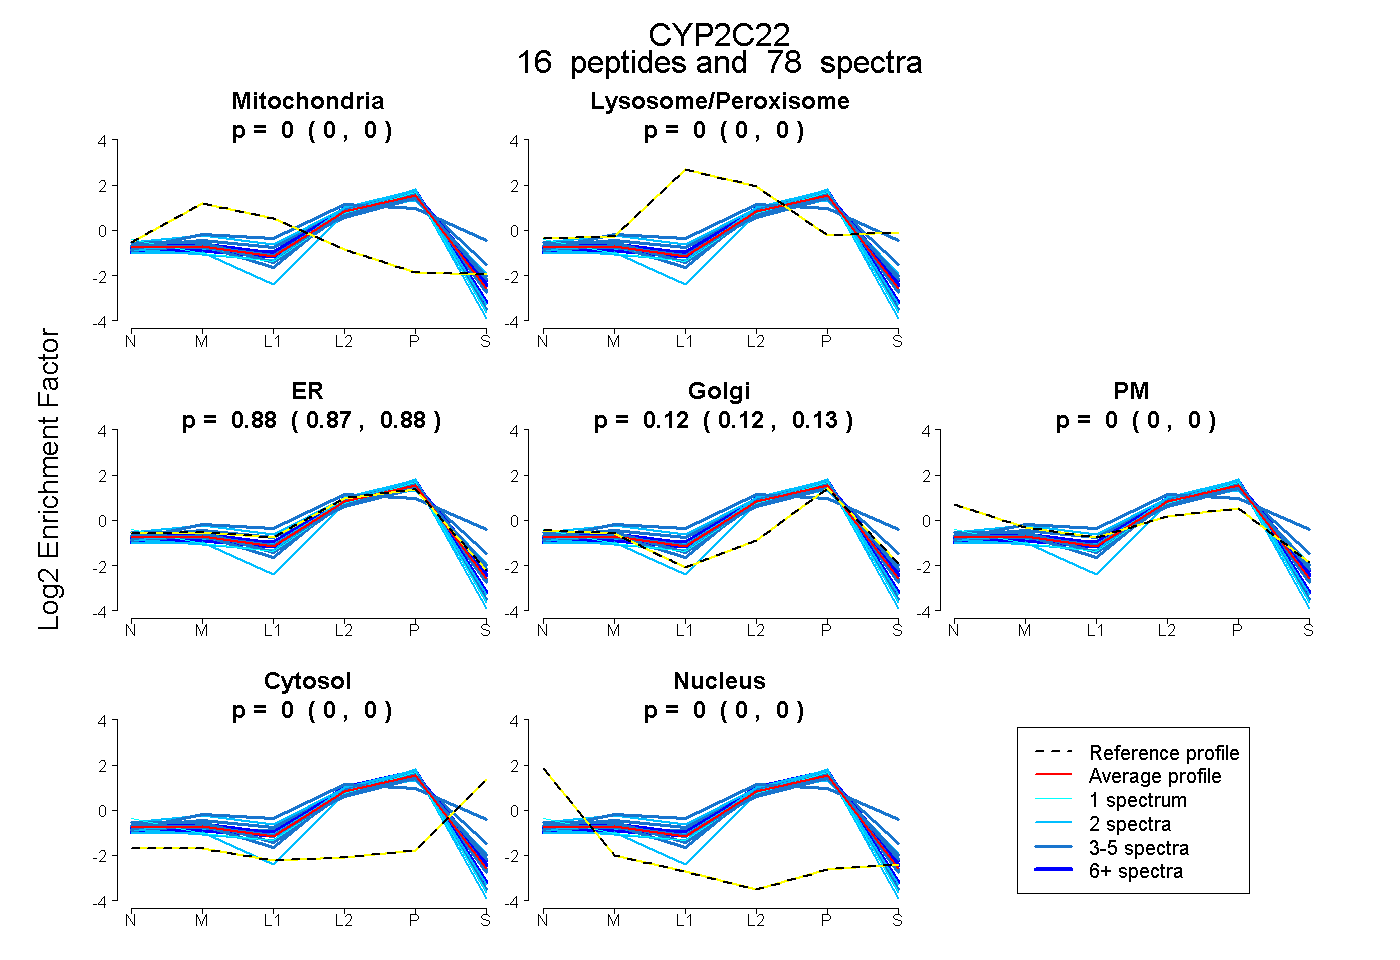 |
0.000 0.000 | 0.000 |
0.000 0.000 | 0.000 |
0.877 0.870 | 0.884 |
0.123 0.115 | 0.129 |
0.000 0.000 | 0.000 |
0.000 0.000 | 0.000 |
0.000 0.000 | 0.000 |
|||
| Plot | Lyso | Other | |||||||||||
| Expt C |
21 peptides |
260 spectra |
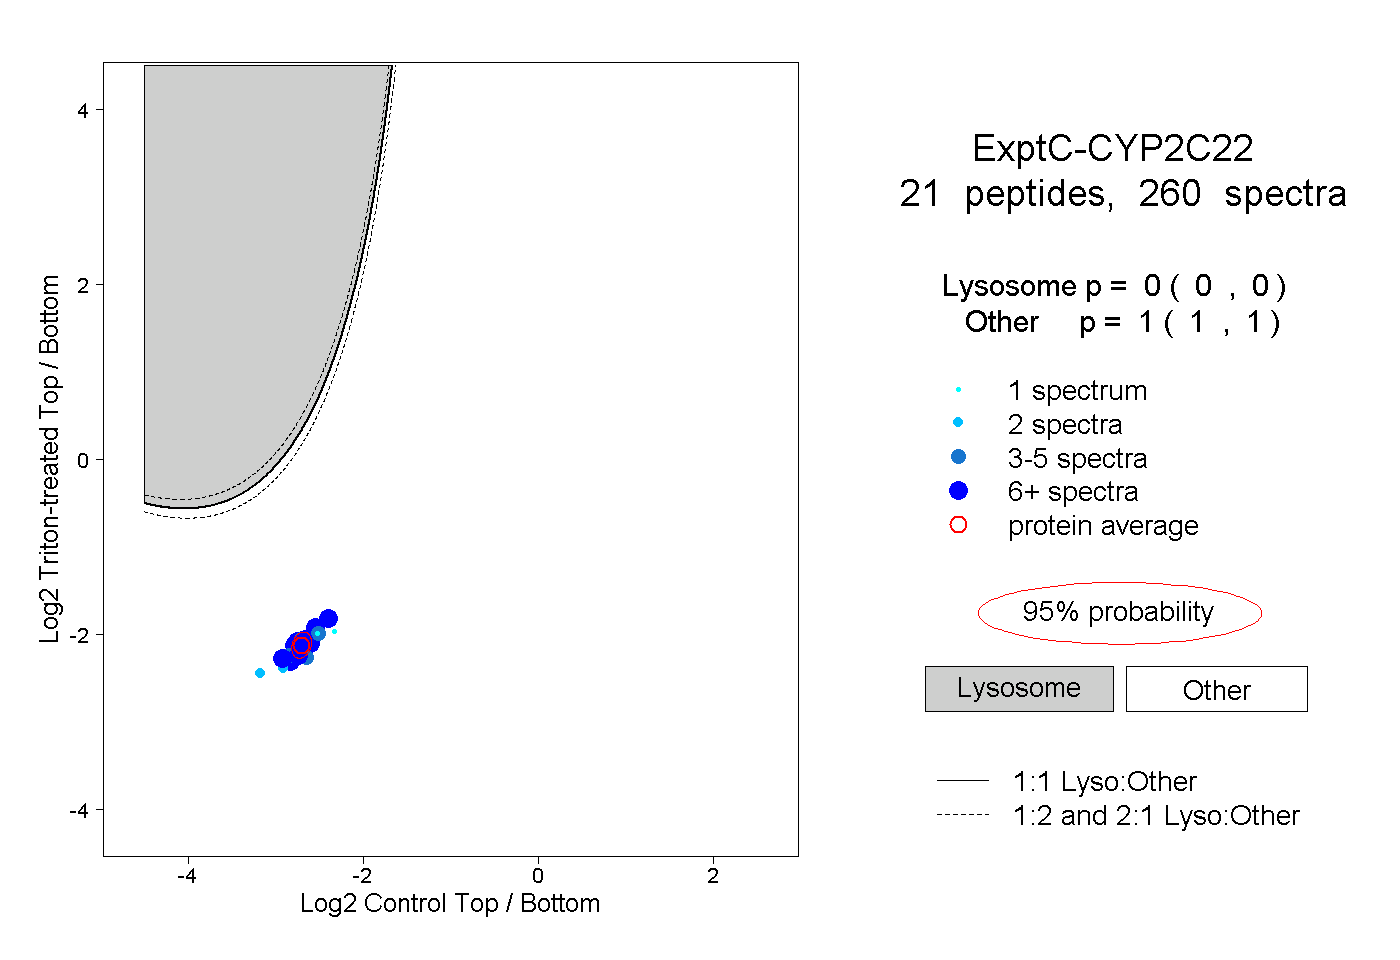 |
0.000 0.000 | 0.000 |
1.000 1.000 | 1.000 |
||||||||
| Plot | Lyso | Other | |||||||||||
| Expt D |
9 peptides |
23 spectra |
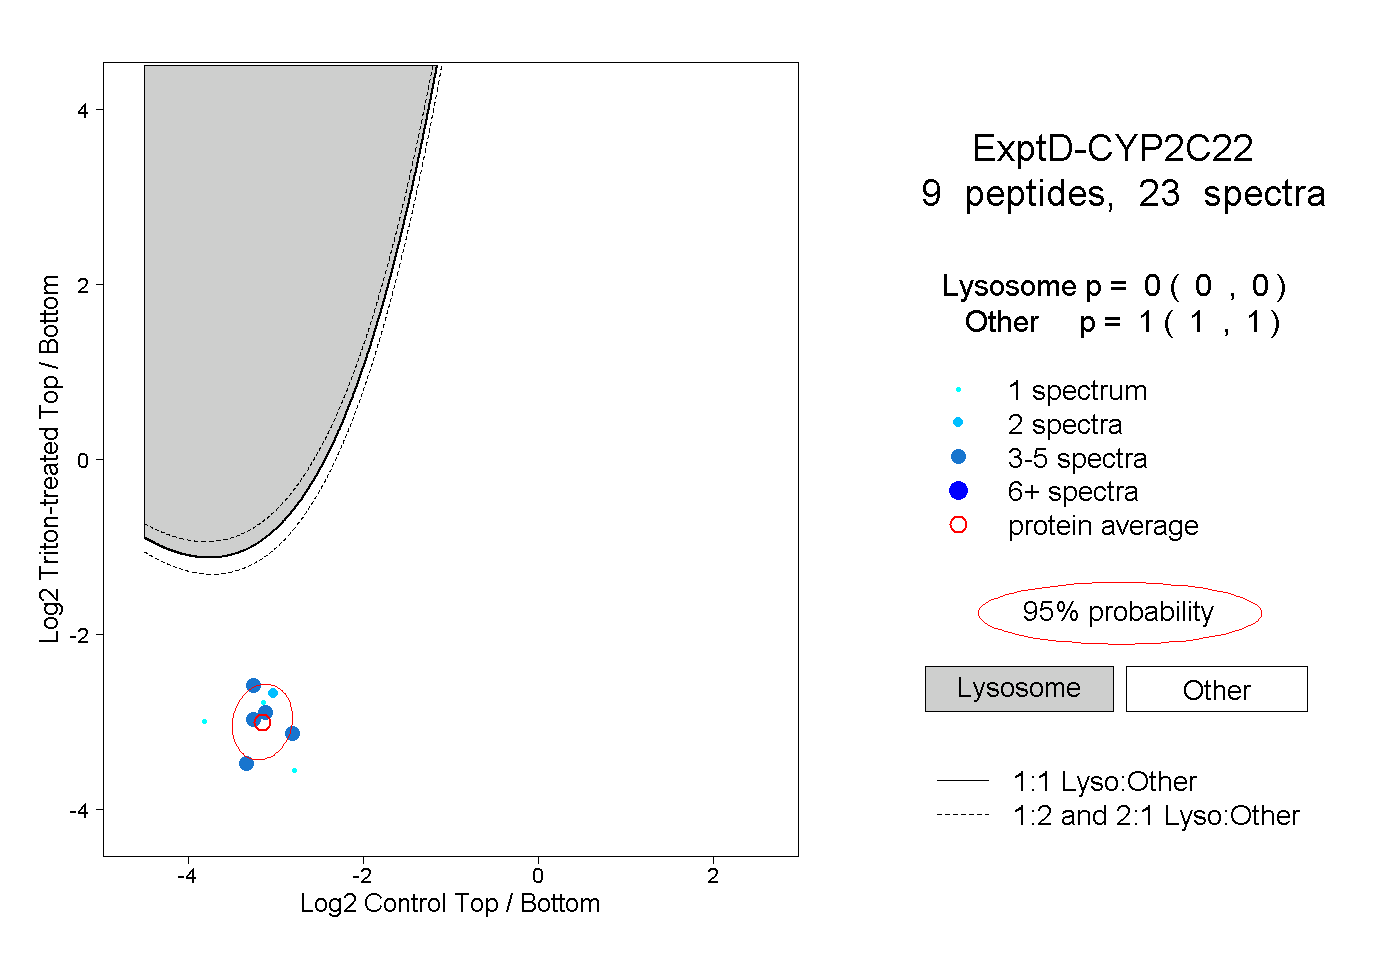 |
0.000 0.000 | 0.000 |
1.000 1.000 | 1.000 |