 7
7peptides
spectra
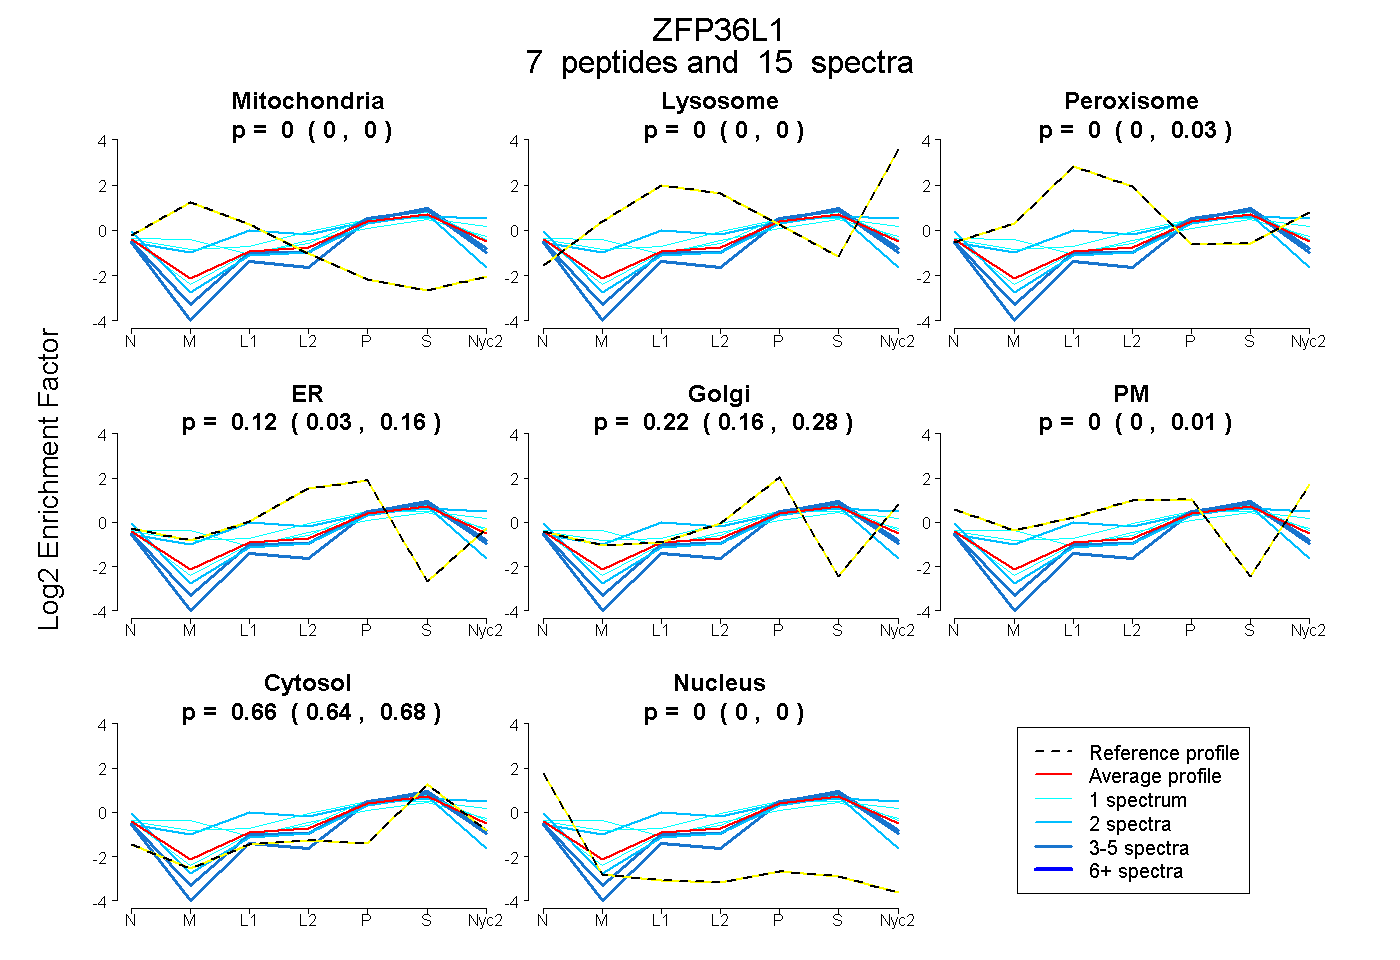
0.000 | 0.000
0.000 | 0.000
0.000 | 0.031
0.033 | 0.158
0.159 | 0.277
0.000 | 0.014
0.638 | 0.677
0.000 | 0.000
4peptides
spectra
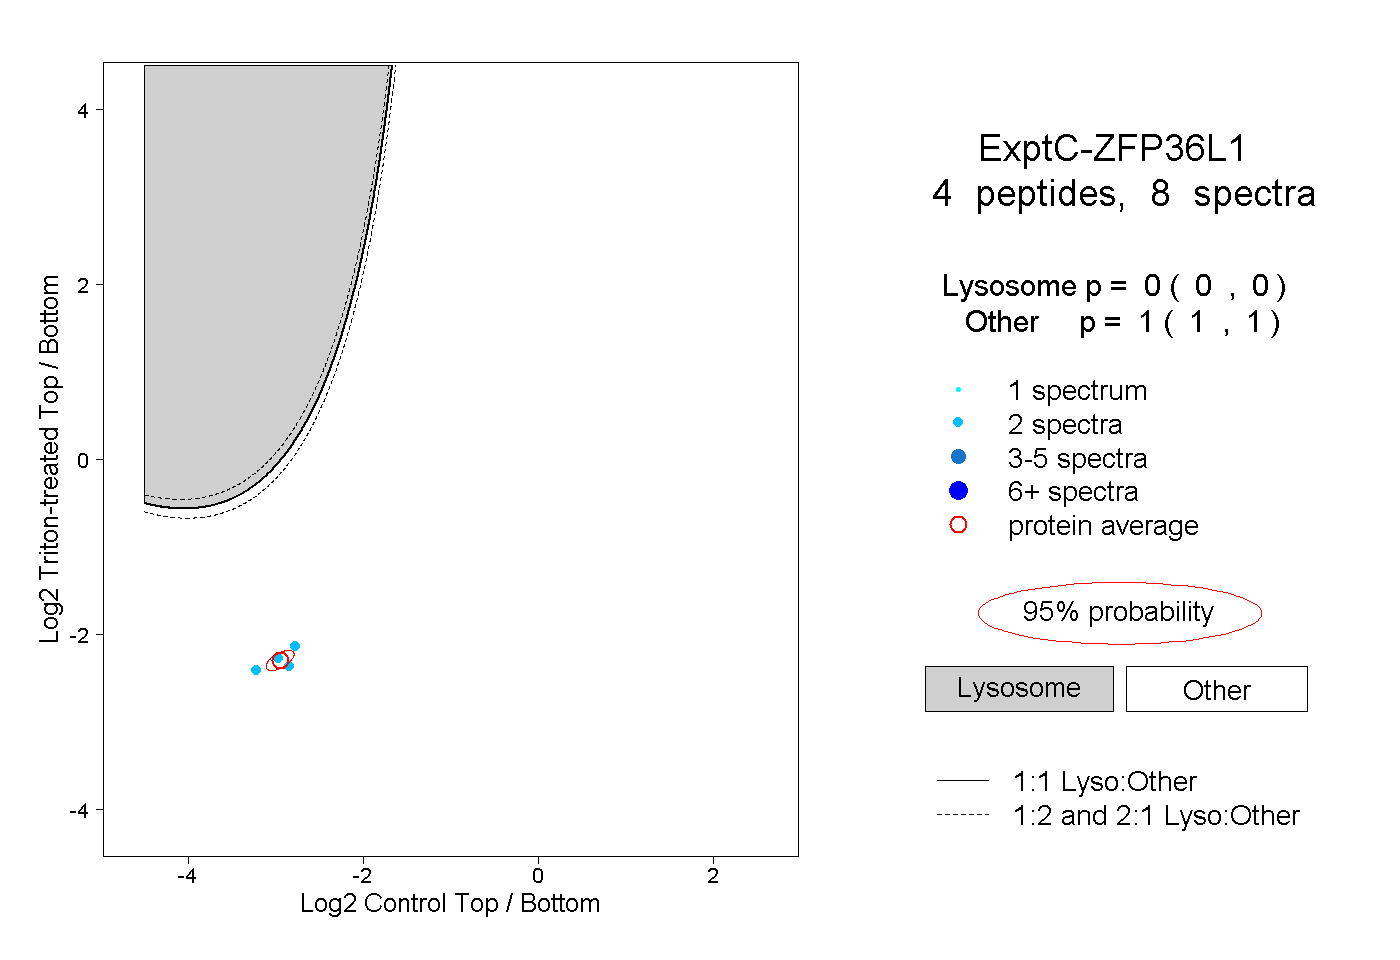
0.000 | 0.000
1.000 | 1.000
| Plot | Mito | Lyso | Perox | ER | Golgi | PM | Cytosol | Nucleus | |||||
| Expt A |
7 peptides |
15 spectra |
|
0.000 0.000 | 0.000 |
0.000 0.000 | 0.000 |
0.002 0.000 | 0.031 |
0.116 0.033 | 0.158 |
0.218 0.159 | 0.277 |
0.000 0.000 | 0.014 |
0.664 0.638 | 0.677 |
0.000 0.000 | 0.000 |
||
| Plot | Lyso | Other | |||||||||||
| Expt C |
4 peptides |
8 spectra |
|
0.000 0.000 | 0.000 |
1.000 1.000 | 1.000 |