 6
6peptides
spectra
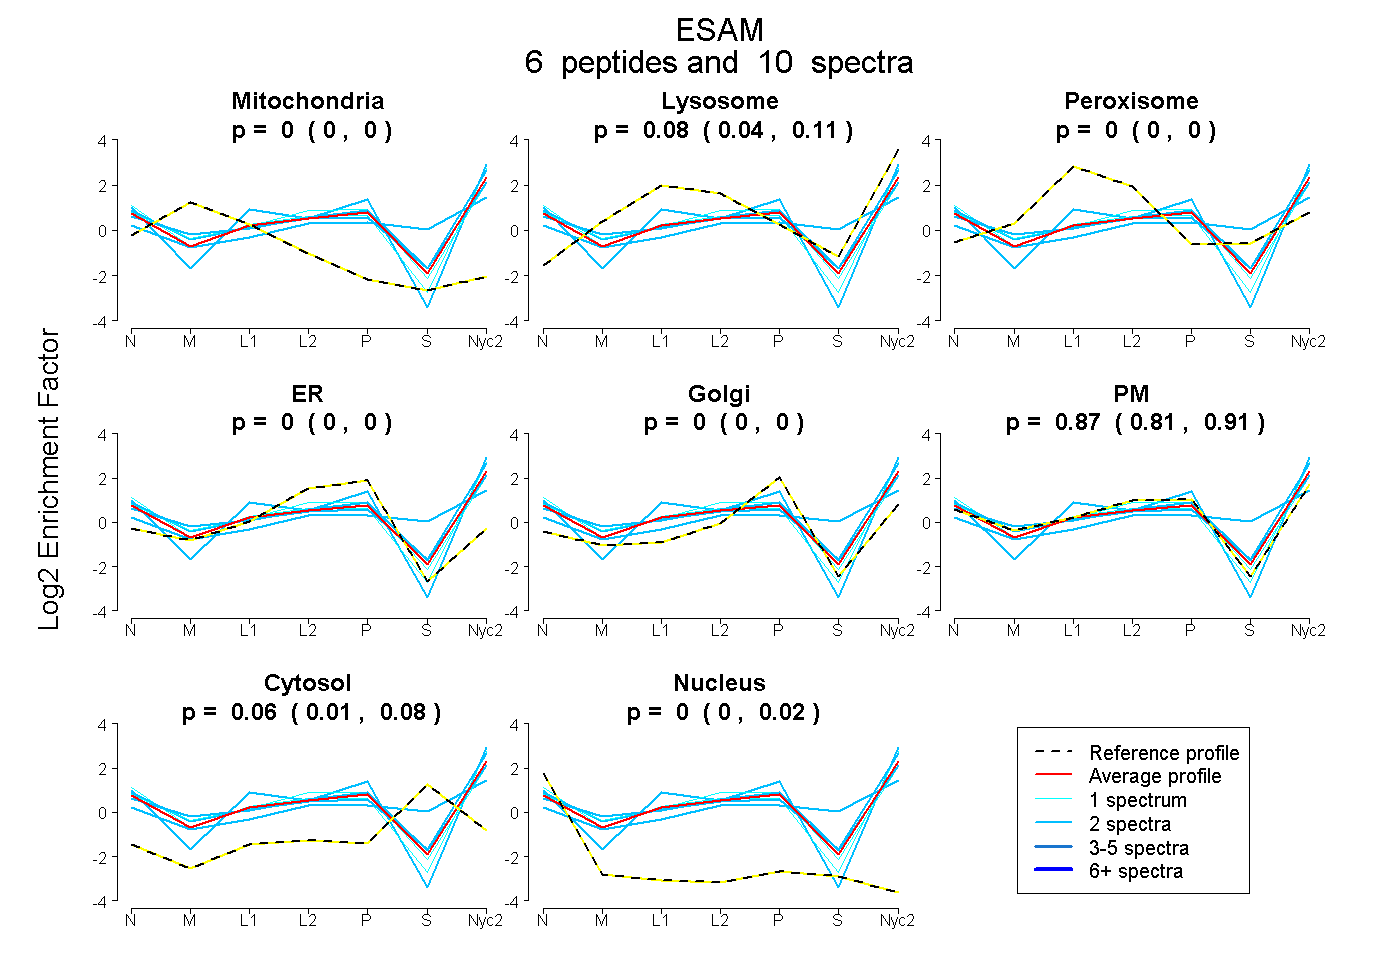
0.000 | 0.000
0.045 | 0.110
0.000 | 0.000
0.000 | 0.000
0.000 | 0.000
0.809 | 0.906
0.005 | 0.081
0.000 | 0.017
| Plot | Mito | Lyso | Perox | ER | Golgi | PM | Cytosol | Nucleus | |||||
| Expt A |
6 peptides |
10 spectra |
|
0.000 0.000 | 0.000 |
0.076 0.045 | 0.110 |
0.000 0.000 | 0.000 |
0.000 0.000 | 0.000 |
0.000 0.000 | 0.000 |
0.868 0.809 | 0.906 |
0.056 0.005 | 0.081 |
0.000 0.000 | 0.017 |
| 1 spectrum, LAPSSQVFFGPALDTVR | 0.000 | 0.021 | 0.000 | 0.000 | 0.000 | 0.979 | 0.000 | 0.000 | ||
| 2 spectra, AAPPRPGTFTPTPSVSSQALSSPR | 0.000 | 0.000 | 0.000 | 0.000 | 0.000 | 1.000 | 0.000 | 0.000 | ||
| 2 spectra, LDALQEGDSGTYR | 0.000 | 0.141 | 0.000 | 0.000 | 0.000 | 0.805 | 0.054 | 0.000 | ||
| 2 spectra, EDAIAPR | 0.000 | 0.167 | 0.000 | 0.000 | 0.000 | 0.467 | 0.367 | 0.000 | ||
| 2 spectra, TLPWTK | 0.000 | 0.098 | 0.000 | 0.000 | 0.000 | 0.839 | 0.064 | 0.000 | ||
| 1 spectrum, QVLSYFK | 0.000 | 0.039 | 0.000 | 0.000 | 0.000 | 0.950 | 0.011 | 0.000 |
| Plot | Lyso | Other | |||||||||||
| Expt C |
4 peptides |
10 spectra |
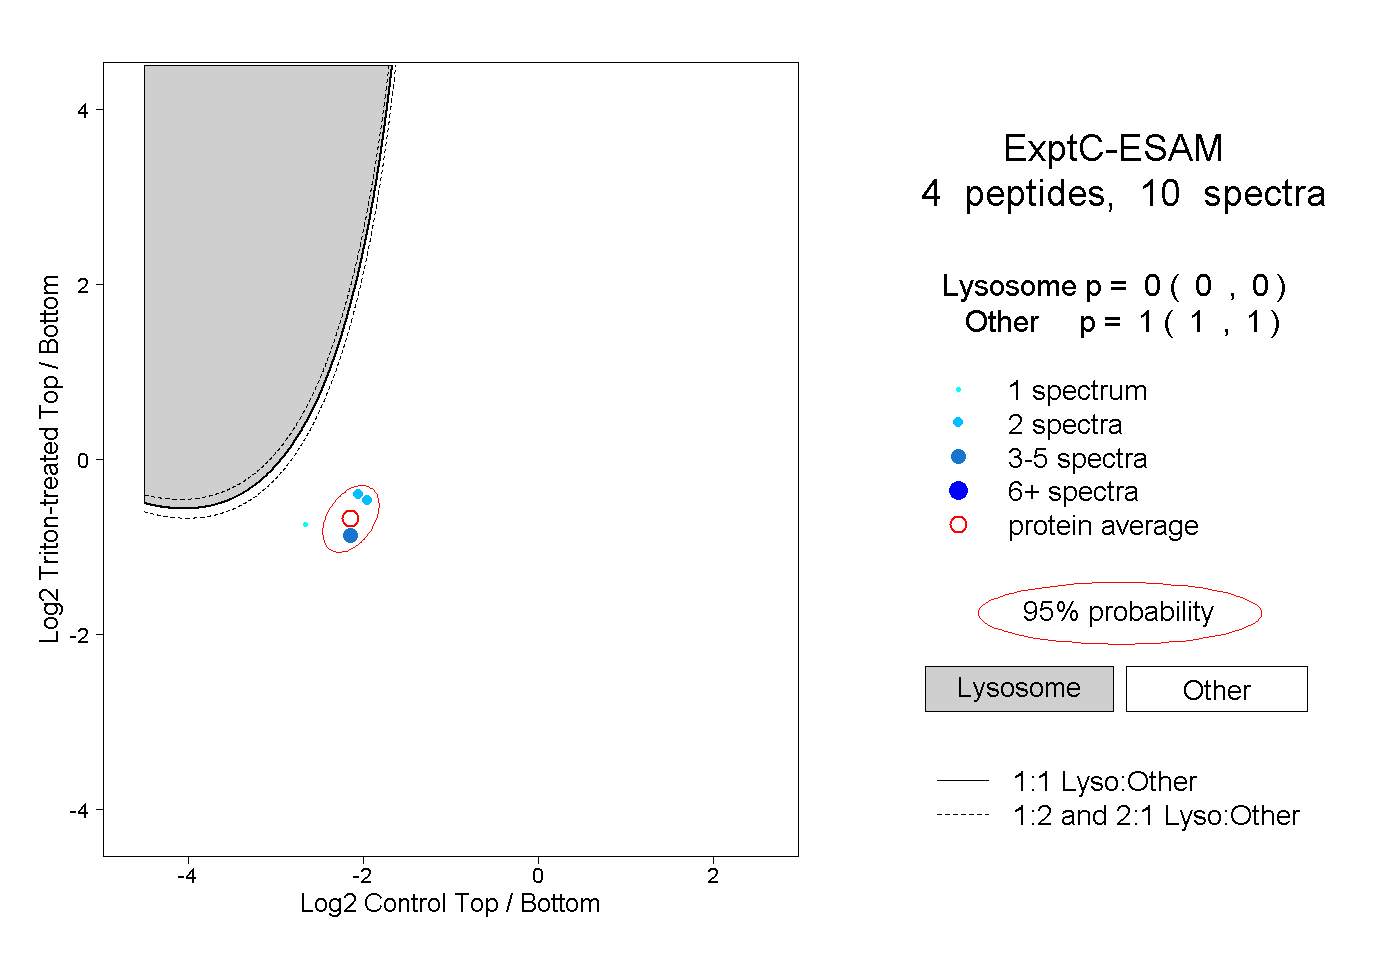 |
0.000 0.000 | 0.000 |
1.000 1.000 | 1.000 |