 4
4peptides
spectra
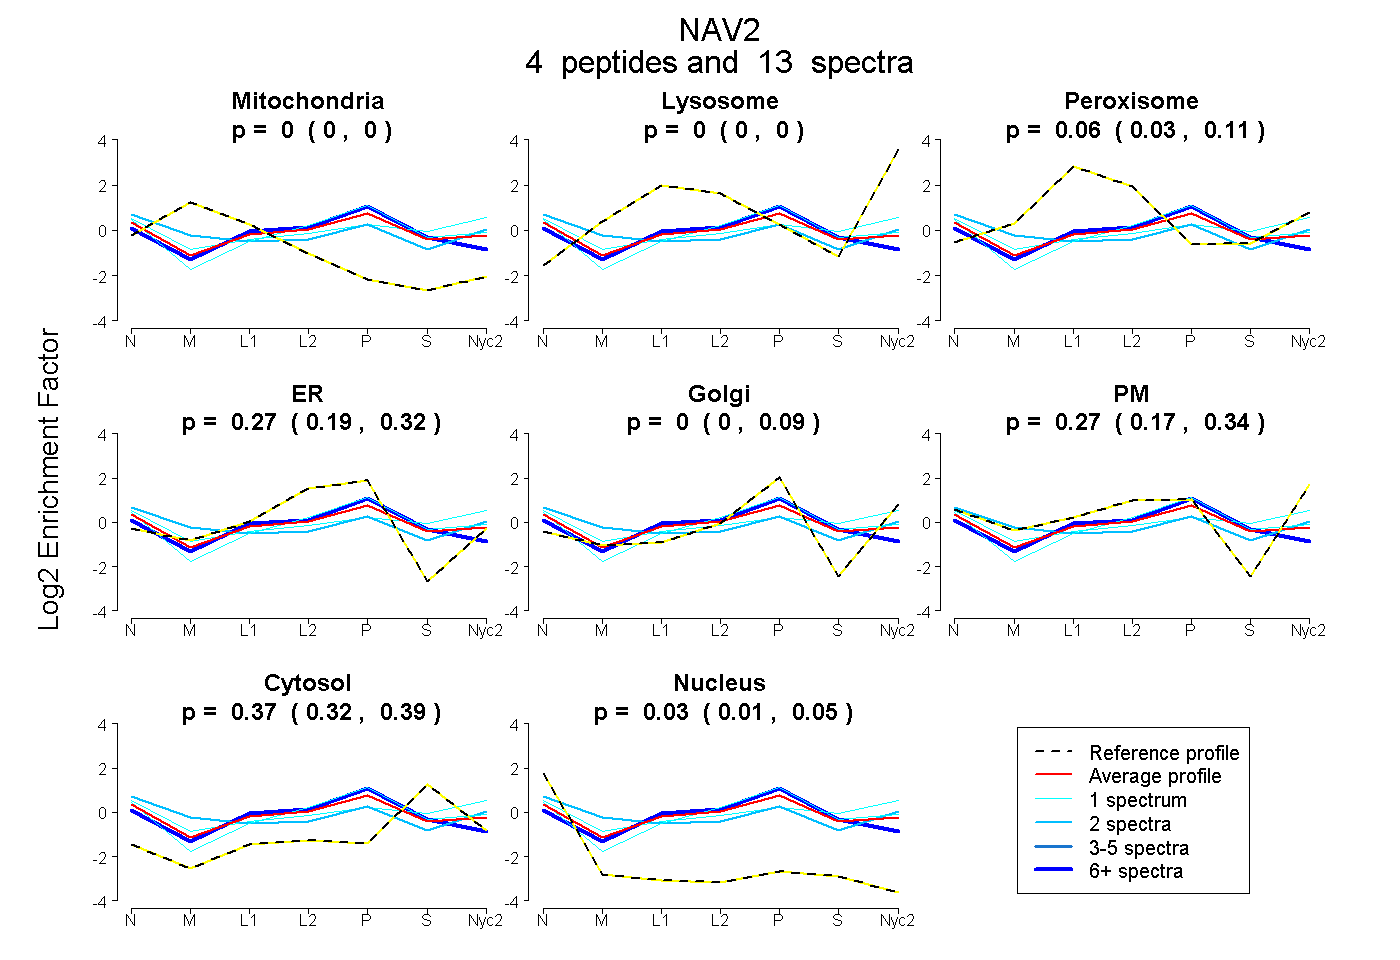
0.000 | 0.000
0.000 | 0.000
0.029 | 0.113
0.185 | 0.320
0.000 | 0.090
0.165 | 0.337
0.325 | 0.385
0.006 | 0.047
| Plot | Mito | Lyso | Perox | ER | Golgi | PM | Cytosol | Nucleus | |||||
| Expt A |
4 peptides |
13 spectra |
|
0.000 0.000 | 0.000 |
0.000 0.000 | 0.000 |
0.064 0.029 | 0.113 |
0.271 0.185 | 0.320 |
0.000 0.000 | 0.090 |
0.273 0.165 | 0.337 |
0.366 0.325 | 0.385 |
0.027 0.006 | 0.047 |
| 9 spectra, APSQVSISASPR | 0.000 | 0.000 | 0.071 | 0.531 | 0.000 | 0.000 | 0.383 | 0.015 | ||
| 2 spectra, STLPR | 0.142 | 0.000 | 0.000 | 0.000 | 0.010 | 0.536 | 0.266 | 0.045 | ||
| 1 spectrum, LFLSCPIDVDGSR | 0.000 | 0.000 | 0.043 | 0.000 | 0.000 | 0.534 | 0.423 | 0.000 | ||
| 1 spectrum, YTDVASPTLR | 0.000 | 0.000 | 0.000 | 0.299 | 0.064 | 0.243 | 0.394 | 0.000 |
| Plot | Lyso | Other | |||||||||||
| Expt C |
3 peptides |
4 spectra |
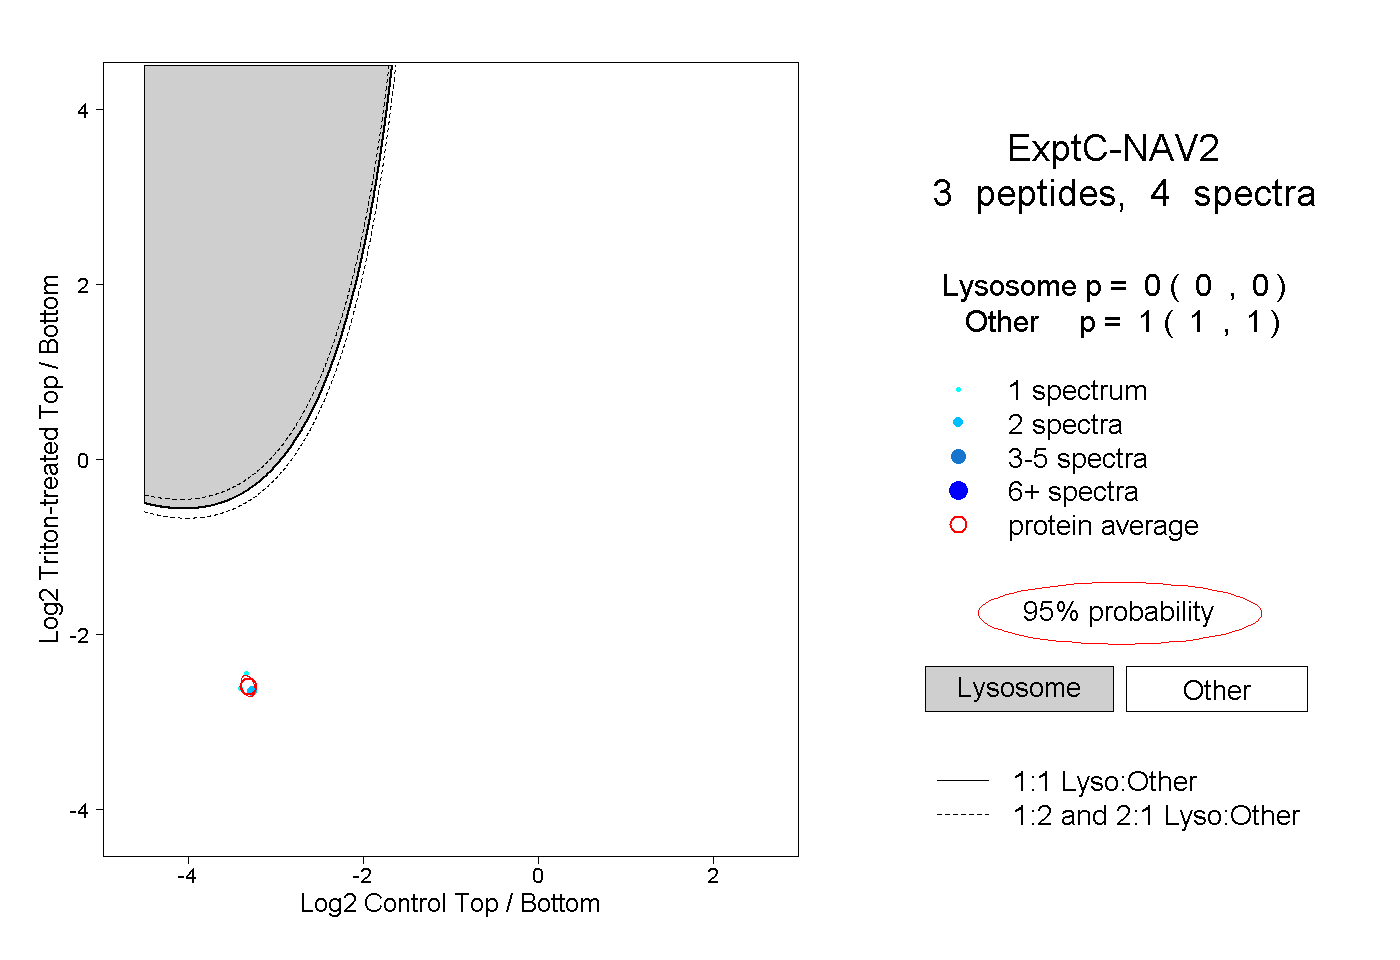 |
0.000 0.000 | 0.000 |
1.000 1.000 | 1.000 |