27
27peptides
spectra
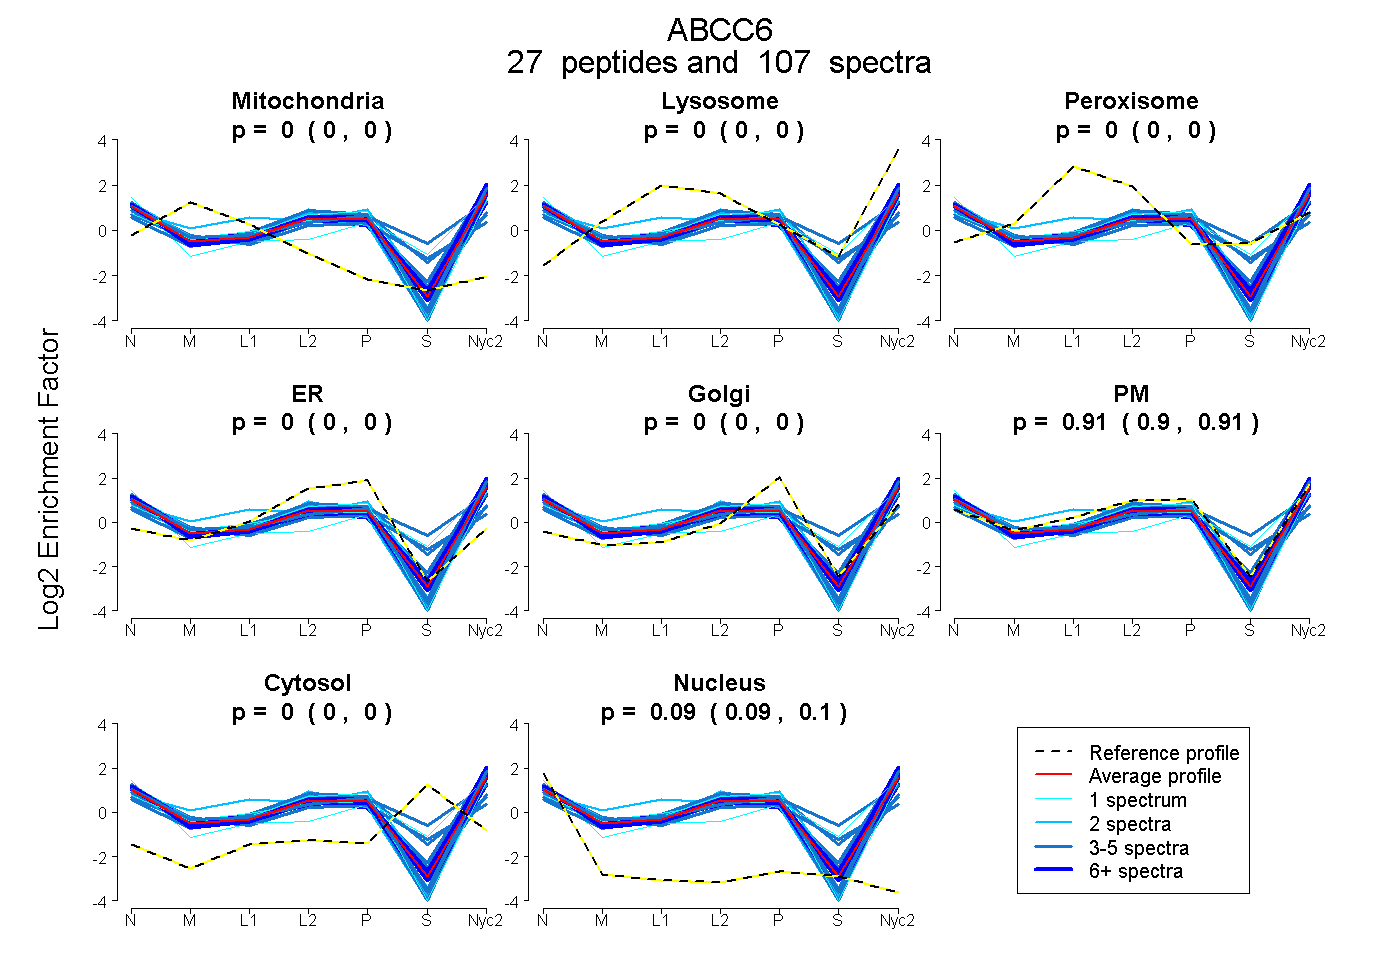
0.000 | 0.000
0.000 | 0.000
0.000 | 0.000
0.000 | 0.000
0.000 | 0.000
0.904 | 0.906
0.000 | 0.000
0.093 | 0.096
9peptides
spectra
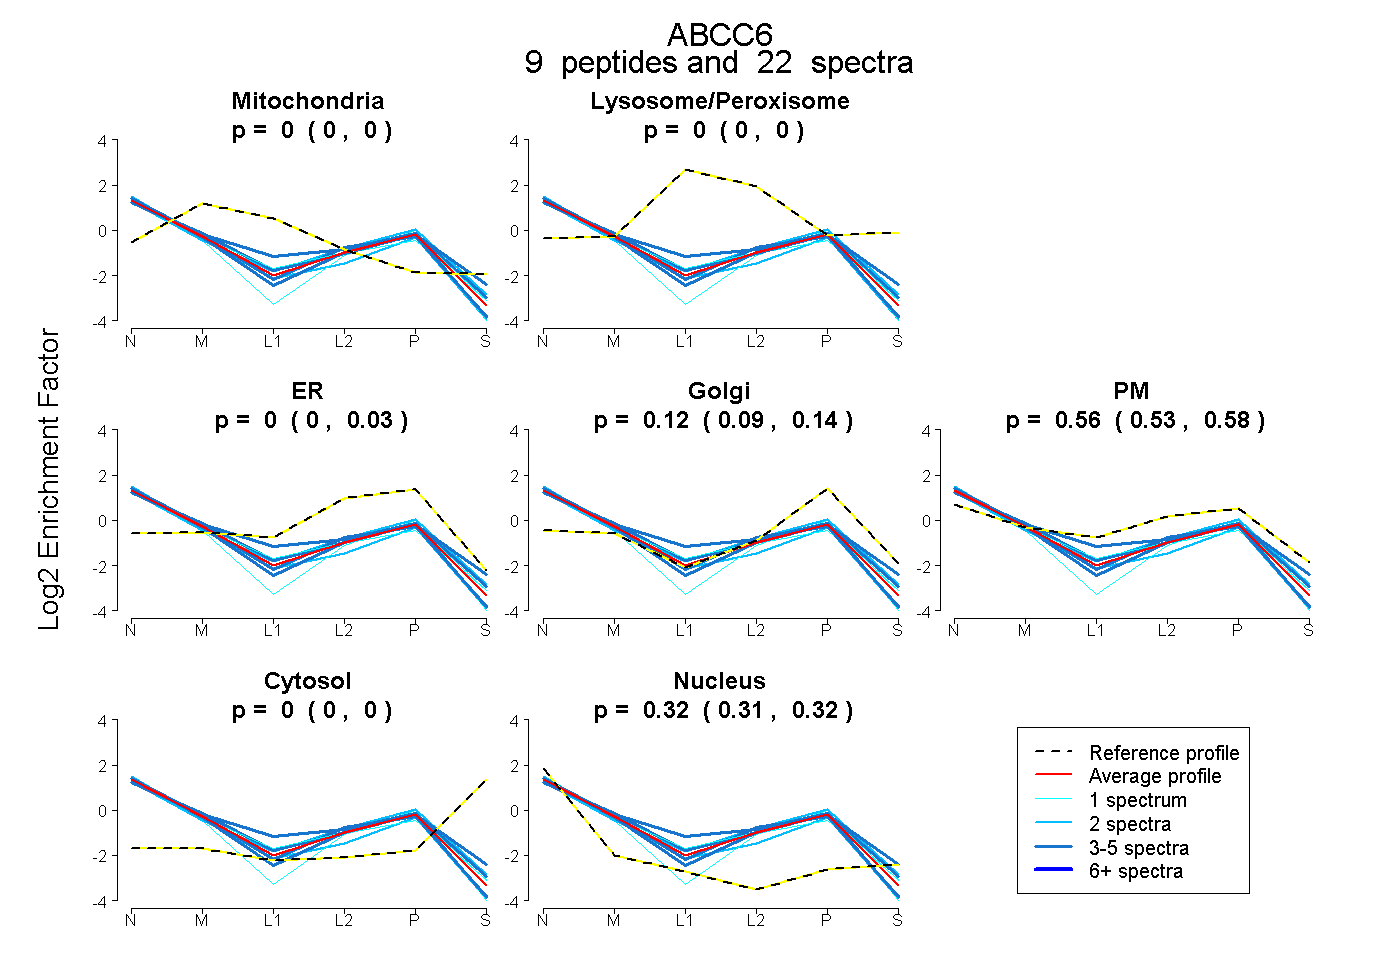
0.000 | 0.000
0.000 | 0.000
0.000 | 0.027
0.095 | 0.138
0.532 | 0.580
0.000 | 0.000
0.311 | 0.324