 4
4peptides
spectra
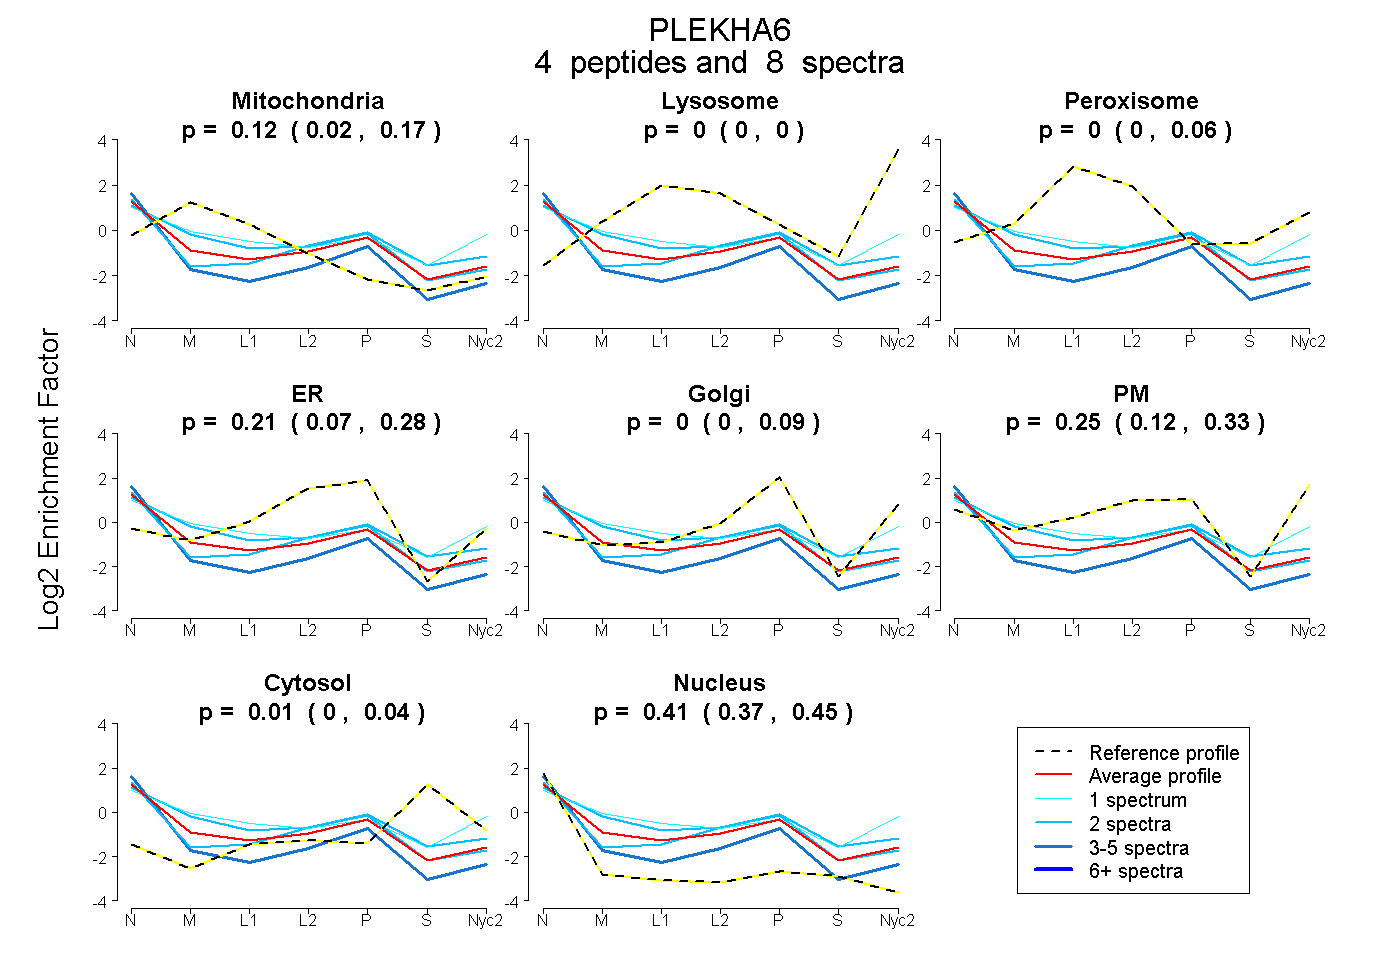
0.021 | 0.174
0.000 | 0.000
0.000 | 0.061
0.073 | 0.284
0.000 | 0.092
0.125 | 0.326
0.000 | 0.041
0.367 | 0.453
| Plot | Mito | Lyso | Perox | ER | Golgi | PM | Cytosol | Nucleus | |||||
| Expt A |
4 peptides |
8 spectra |
|
0.117 0.021 | 0.174 |
0.000 0.000 | 0.000 |
0.000 0.000 | 0.061 |
0.209 0.073 | 0.284 |
0.003 0.000 | 0.092 |
0.253 0.125 | 0.326 |
0.005 0.000 | 0.041 |
0.413 0.367 | 0.453 |
| 1 spectrum, QEVEAEK | 0.241 | 0.000 | 0.000 | 0.000 | 0.000 | 0.504 | 0.112 | 0.143 | ||
| 2 spectra, DGLHTFK | 0.285 | 0.000 | 0.000 | 0.296 | 0.000 | 0.145 | 0.000 | 0.275 | ||
| 3 spectra, AEEPGGQAYETPR | 0.000 | 0.000 | 0.000 | 0.231 | 0.048 | 0.073 | 0.000 | 0.648 | ||
| 2 spectra, MSVEEQMDR | 0.000 | 0.000 | 0.000 | 0.175 | 0.000 | 0.313 | 0.136 | 0.376 |
| Plot | Lyso | Other | |||||||||||
| Expt C |
2 peptides |
3 spectra |
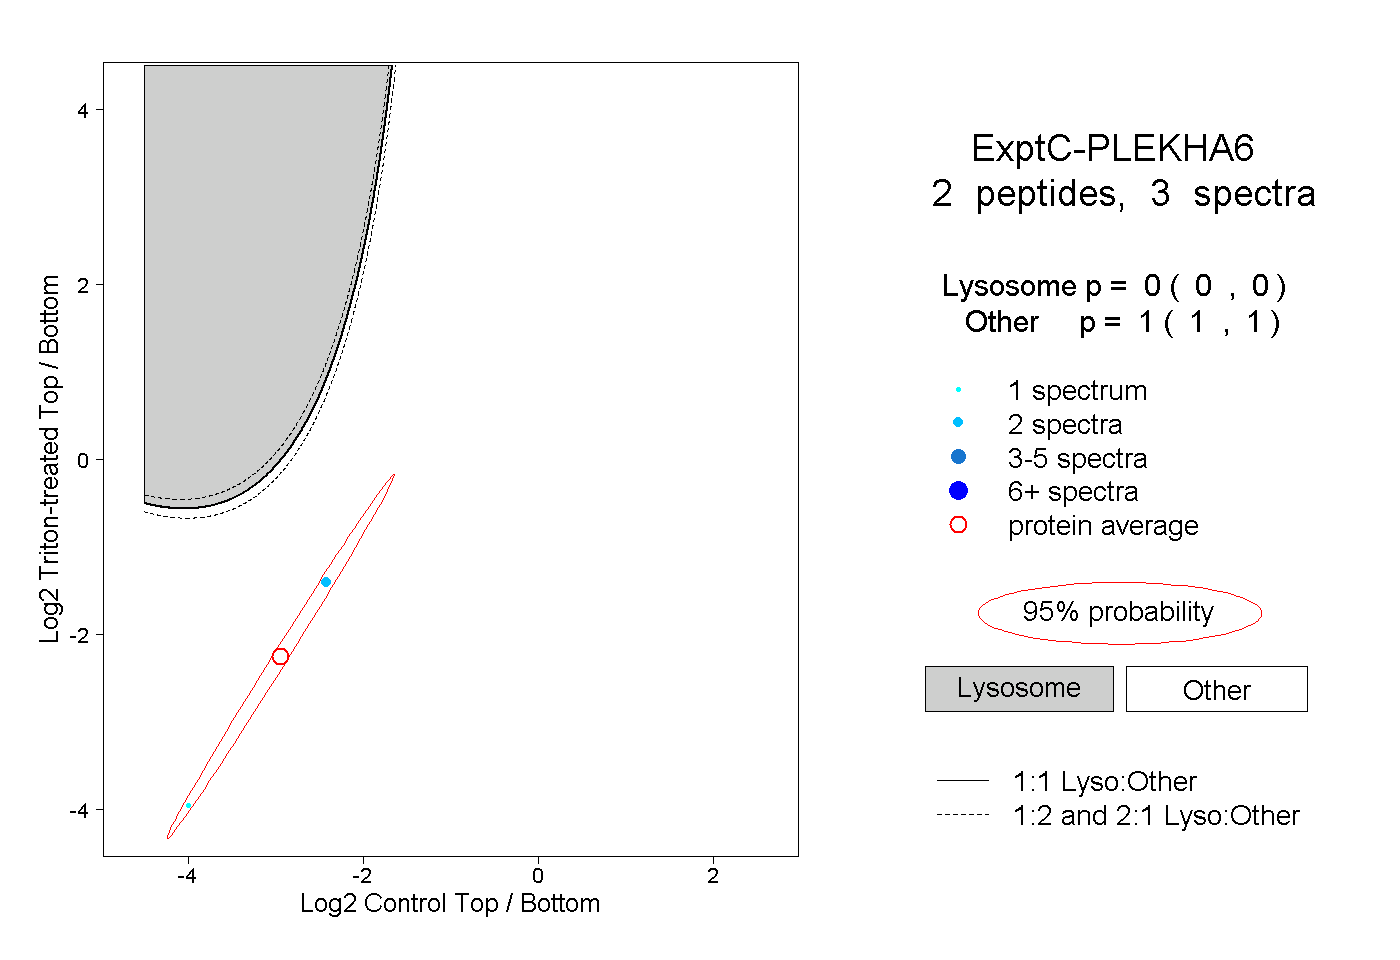 |
0.000 0.000 | 0.000 |
1.000 1.000 | 1.000 |