 3
3peptides
spectra
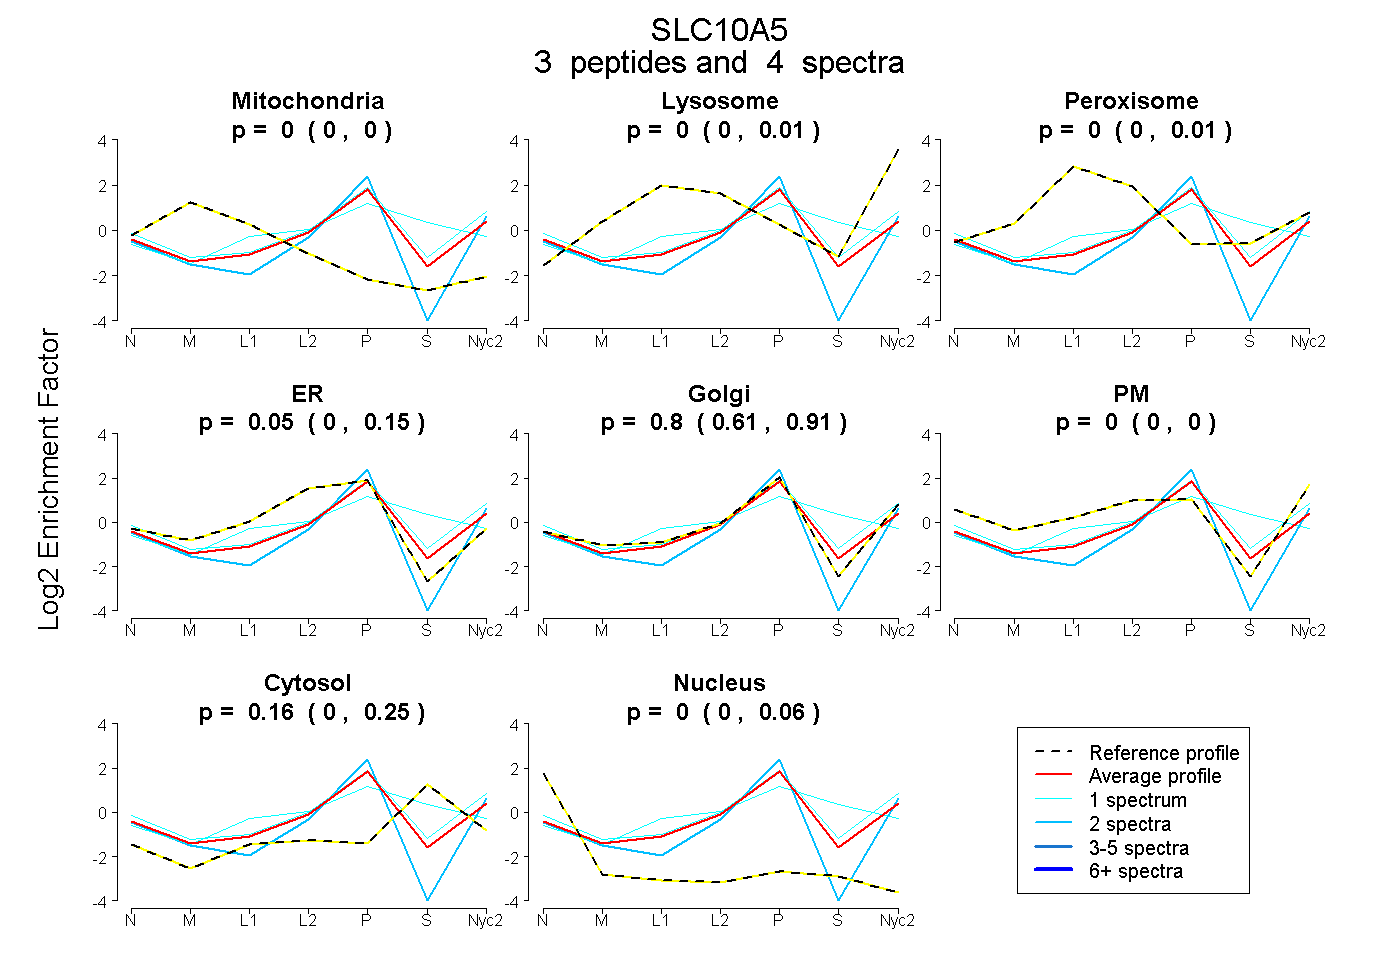
0.000 | 0.000
0.000 | 0.009
0.000 | 0.014
0.000 | 0.151
0.611 | 0.909
0.000 | 0.000
0.000 | 0.253
0.000 | 0.060
| Plot | Mito | Lyso | Perox | ER | Golgi | PM | Cytosol | Nucleus | |||||
| Expt A |
3 peptides |
4 spectra |
|
0.000 0.000 | 0.000 |
0.000 0.000 | 0.009 |
0.000 0.000 | 0.014 |
0.047 0.000 | 0.151 |
0.797 0.611 | 0.909 |
0.000 0.000 | 0.000 |
0.156 0.000 | 0.253 |
0.000 0.000 | 0.060 |
| 1 spectrum, SSYEGK | 0.000 | 0.005 | 0.000 | 0.000 | 0.750 | 0.089 | 0.156 | 0.000 | ||
| 2 spectra, LIEEITNIR | 0.000 | 0.000 | 0.000 | 0.000 | 0.942 | 0.000 | 0.000 | 0.058 | ||
| 1 spectrum, VYLLPLPVCK | 0.000 | 0.000 | 0.117 | 0.244 | 0.199 | 0.000 | 0.440 | 0.000 |
| Plot | Lyso | Other | |||||||||||
| Expt C |
2 peptides |
5 spectra |
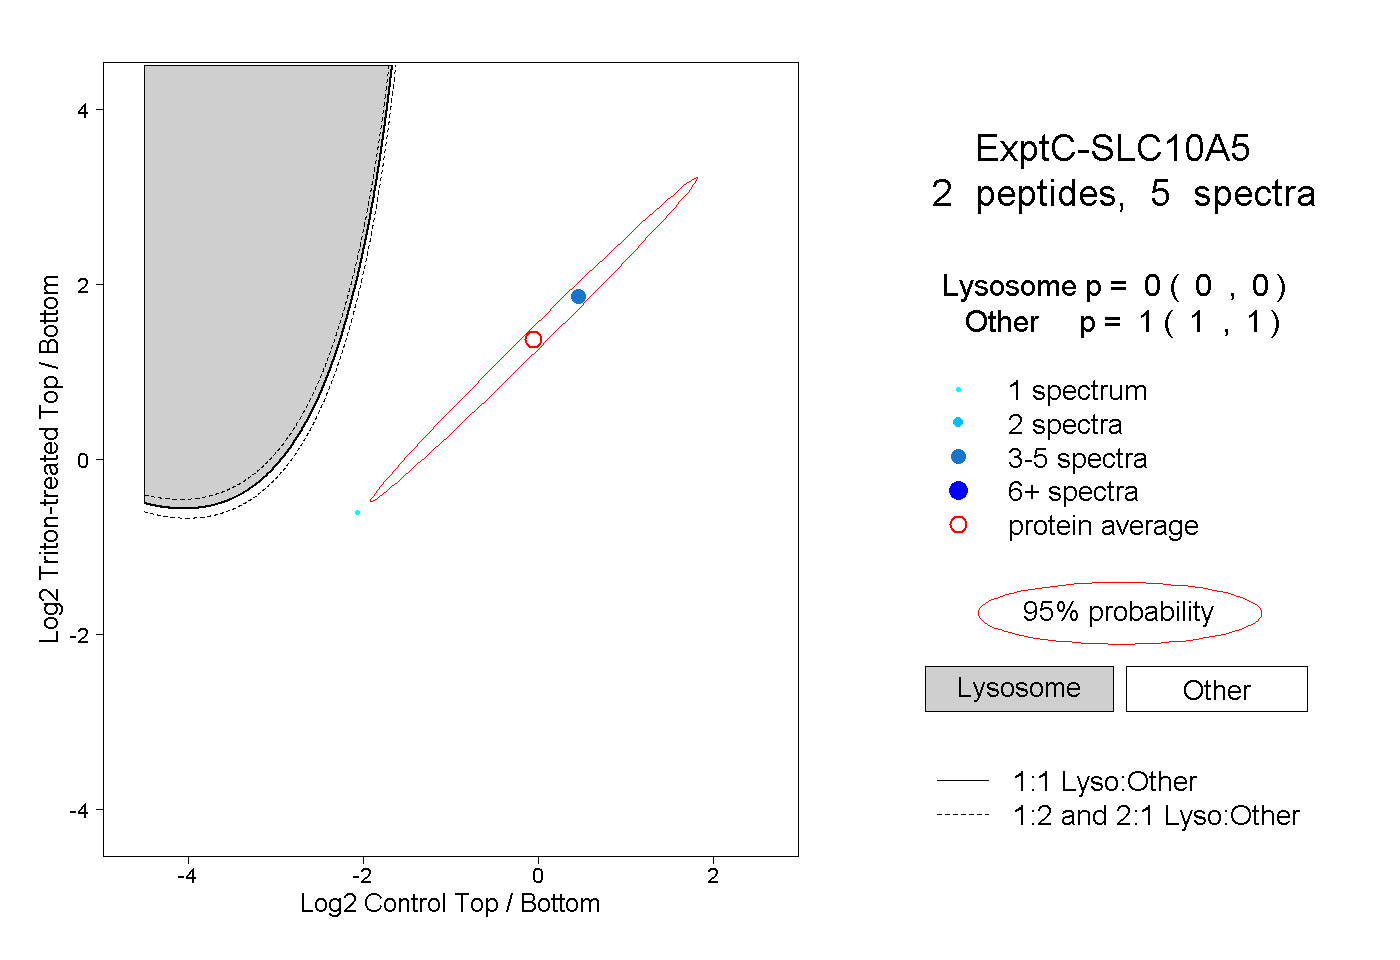 |
0.000 0.000 | 0.000 |
1.000 1.000 | 1.000 |