 3
3peptides
spectra
0.000 | 0.084
0.000 | 0.000
0.000 | 0.159
0.121 | 0.256
0.000 | 0.000
0.174 | 0.305
0.371 | 0.510
0.000 | 0.050
1peptide
spectra
NA | NA
NA | NA
| Plot | Mito | Lyso | Perox | ER | Golgi | PM | Cytosol | Nucleus | |||||
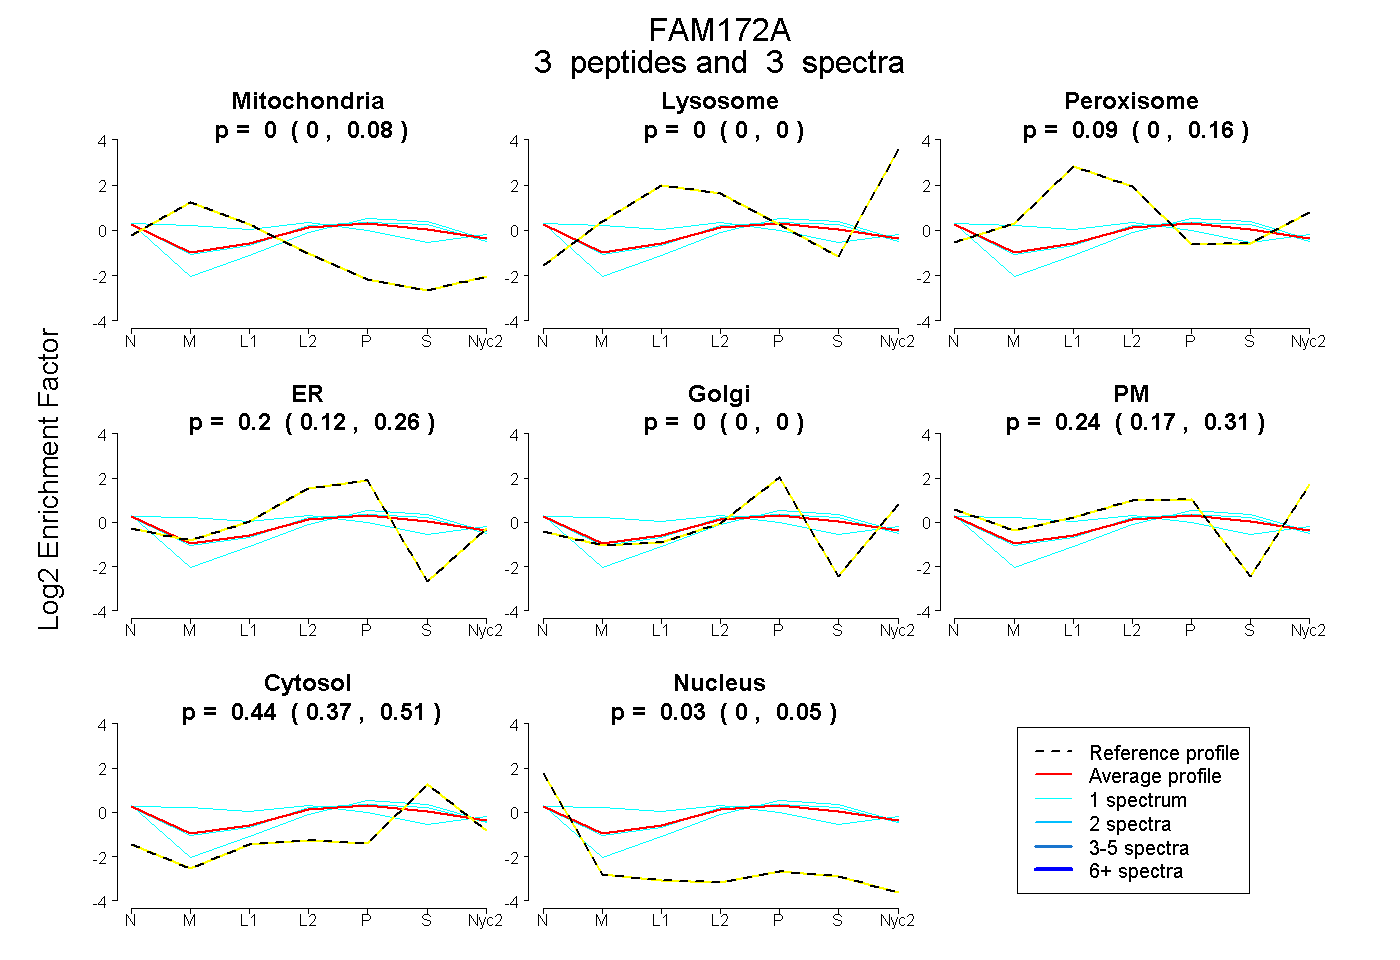
| Expt A |
3 peptides |
3 spectra |
|
0.000 0.000 | 0.084 |
0.000 0.000 | 0.000 |
0.091 0.000 | 0.159 |
0.197 0.121 | 0.256 |
0.000 0.000 | 0.000 |
0.244 0.174 | 0.305 |
0.440 0.371 | 0.510 |
0.029 0.000 | 0.050 |
||
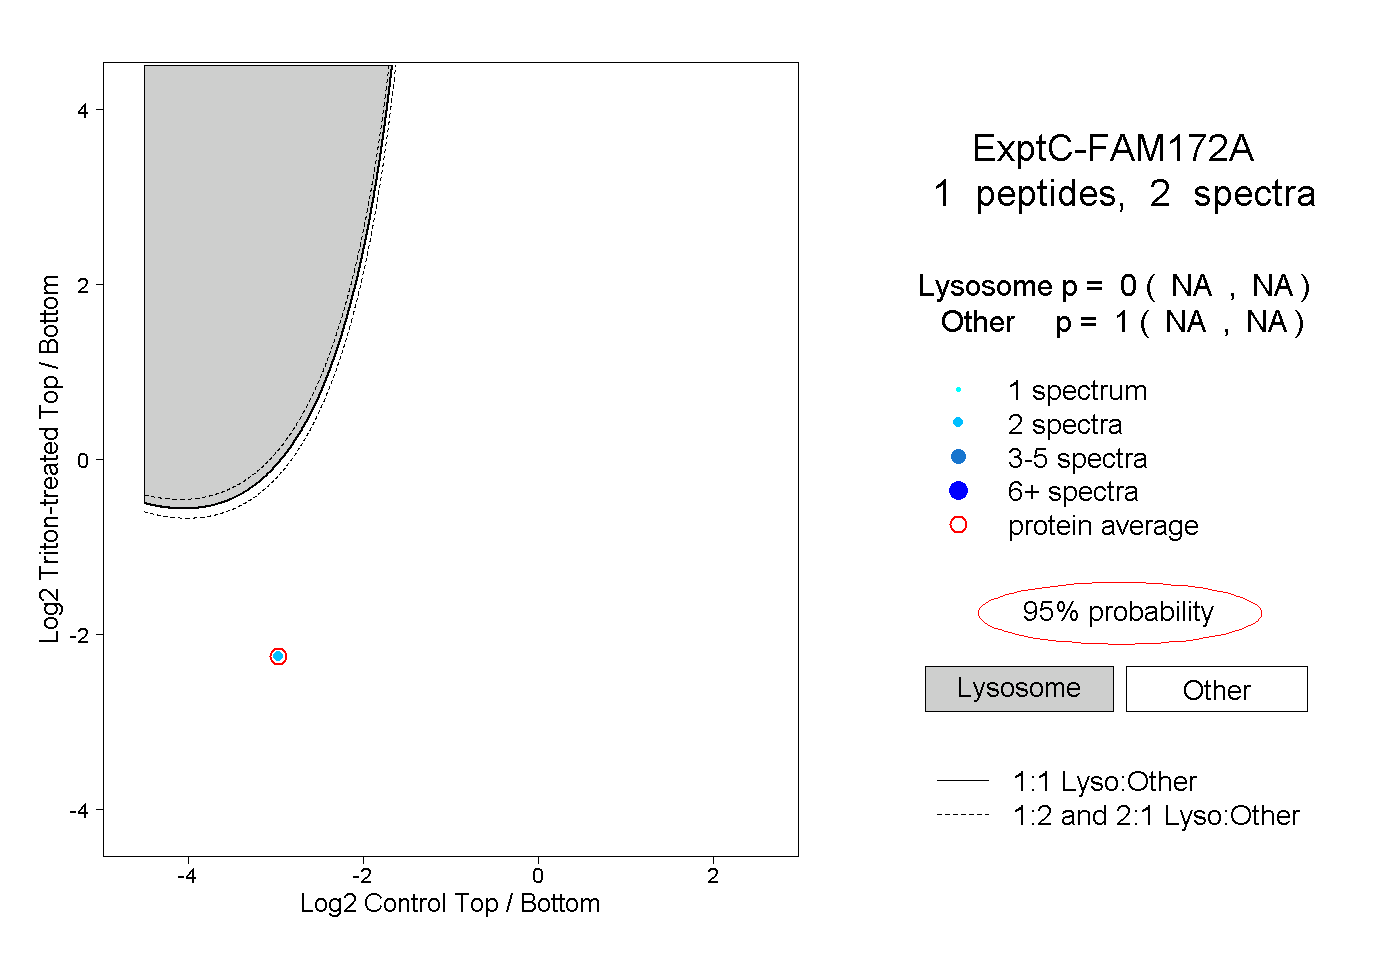
| Plot | Lyso | Other | |||||||||||
| Expt C |
1 peptide |
2 spectra |
|
0.000 NA | NA |
1.000 NA | NA |