 3
3peptides
spectra
0.000 | 0.000
0.000 | 0.100
0.000 | 0.103
0.000 | 0.350
0.000 | 0.330
0.000 | 0.409
0.435 | 0.654
0.000 | 0.014
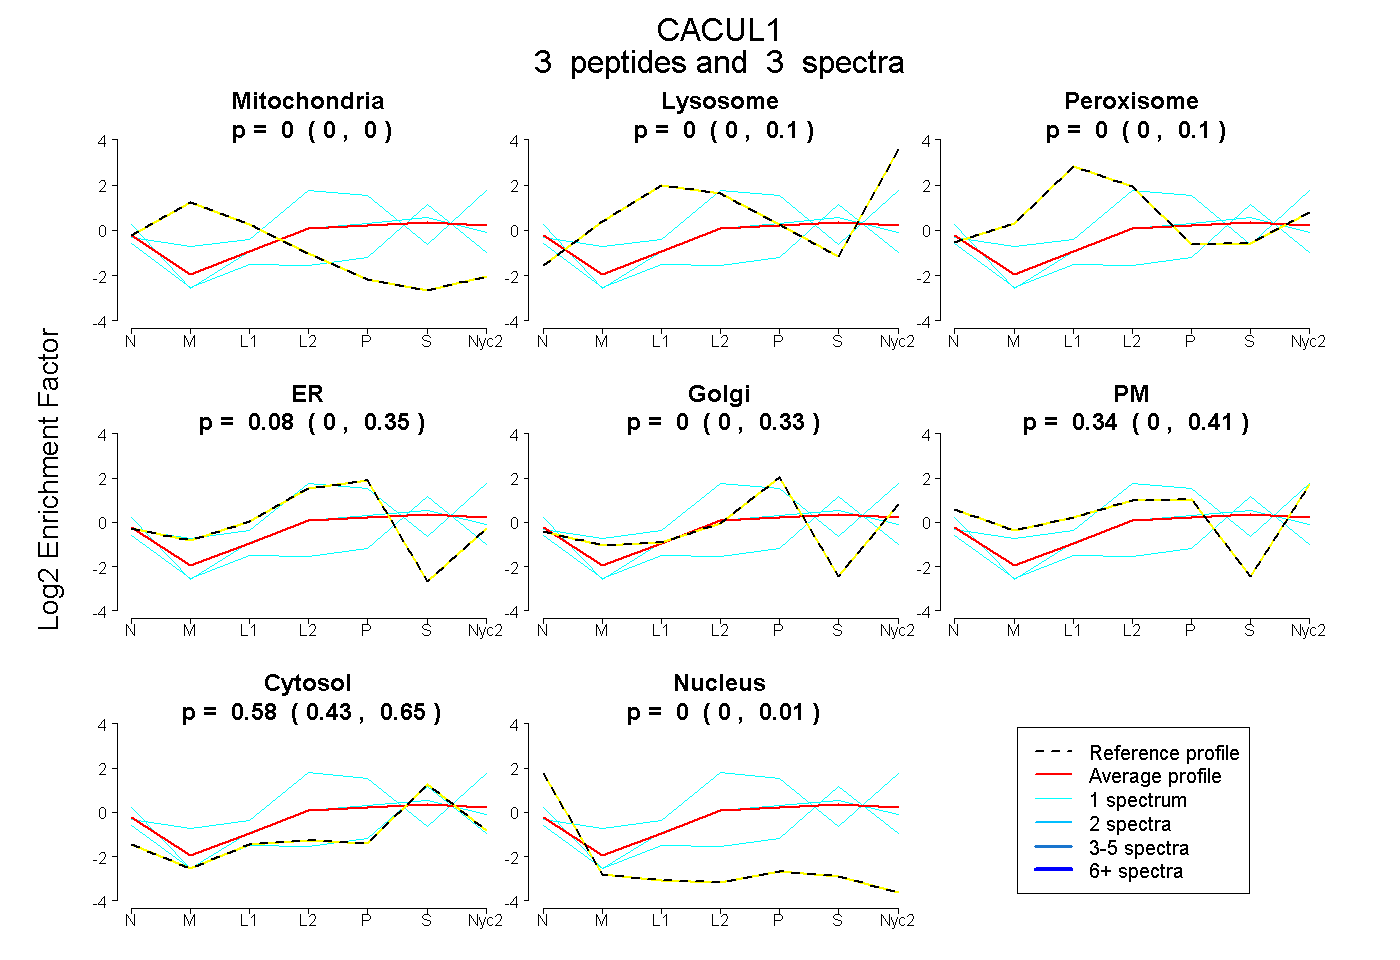
| Plot | Mito | Lyso | Perox | ER | Golgi | PM | Cytosol | Nucleus | |||||
| Expt A |
3 peptides |
3 spectra |
|
0.000 0.000 | 0.000 |
0.000 0.000 | 0.100 |
0.000 0.000 | 0.103 |
0.079 0.000 | 0.350 |
0.000 0.000 | 0.330 |
0.340 0.000 | 0.409 |
0.581 0.435 | 0.654 |
0.000 0.000 | 0.014 |