 15
15peptides
spectra
0.051 | 0.064
0.934 | 0.948
0.000 | 0.000
0.000 | 0.000
0.000 | 0.000
0.000 | 0.000
0.000 | 0.000
0.000 | 0.000
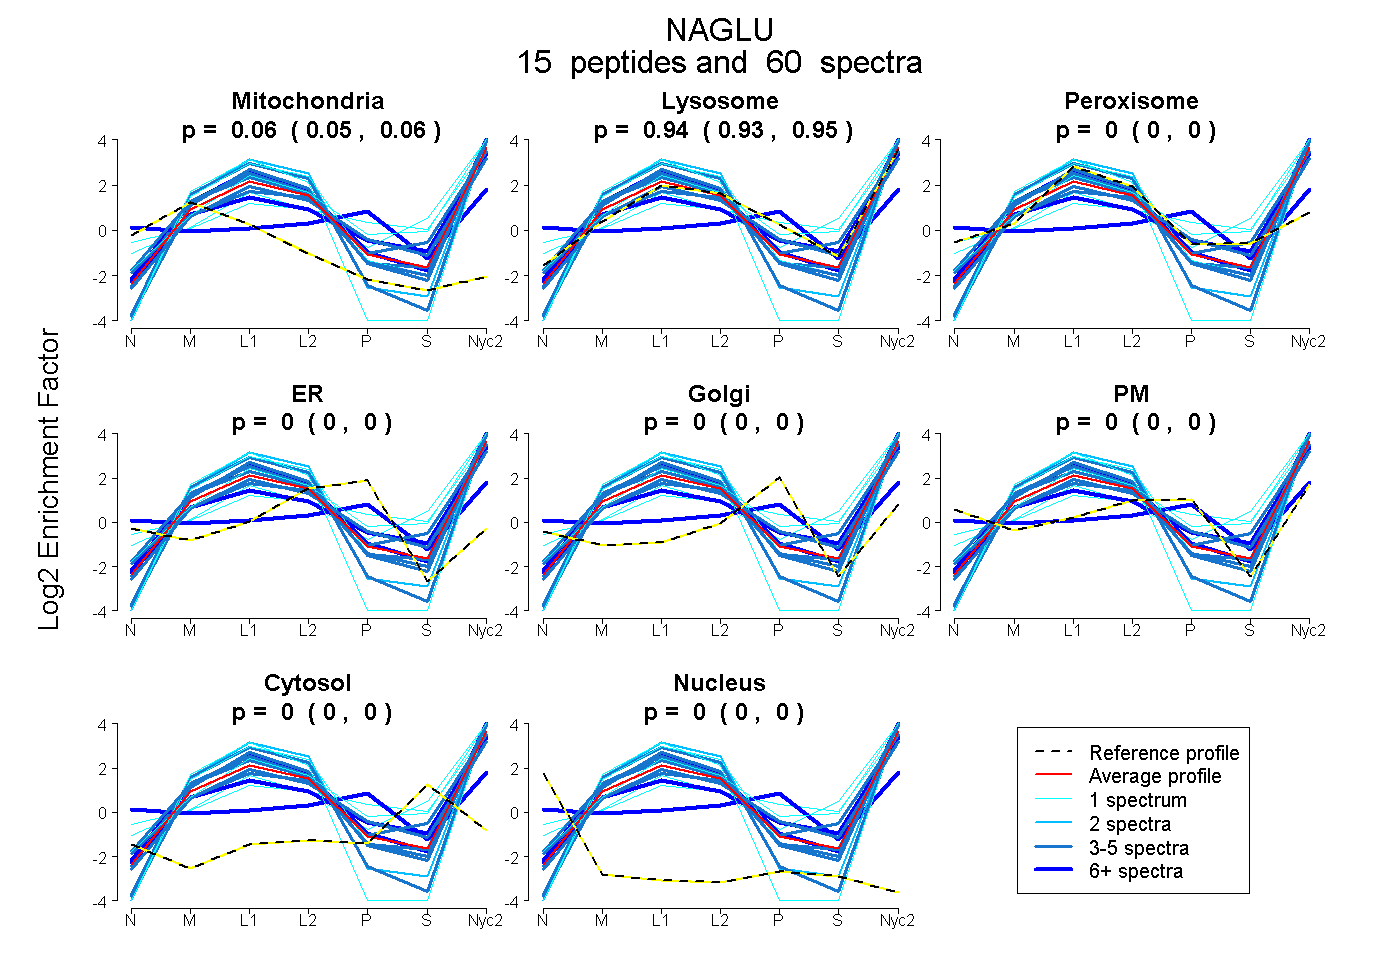
| Plot | Mito | Lyso | Perox | ER | Golgi | PM | Cytosol | Nucleus | |||||
| Expt A |
15 peptides |
60 spectra |
|
0.058 0.051 | 0.064 |
0.942 0.934 | 0.948 |
0.000 0.000 | 0.000 |
0.000 0.000 | 0.000 |
0.000 0.000 | 0.000 |
0.000 0.000 | 0.000 |
0.000 0.000 | 0.000 |
0.000 0.000 | 0.000 |
| 5 spectra, SDVFEAWR | 0.000 | 1.000 | 0.000 | 0.000 | 0.000 | 0.000 | 0.000 | 0.000 | ||
| 3 spectra, YGVSQPDAVAAWR | 0.051 | 0.926 | 0.000 | 0.000 | 0.000 | 0.000 | 0.023 | 0.000 | ||
| 7 spectra, GSSGVAAAAGLHR | 0.000 | 0.190 | 0.000 | 0.000 | 0.061 | 0.602 | 0.147 | 0.000 | ||
| 6 spectra, AVLEAVPR | 0.007 | 0.993 | 0.000 | 0.000 | 0.000 | 0.000 | 0.000 | 0.000 | ||
| 1 spectrum, AAPNLTASPAFR | 0.000 | 0.862 | 0.000 | 0.000 | 0.000 | 0.000 | 0.138 | 0.000 | ||
| 1 spectrum, YPIQPQGDTVDLSK | 0.000 | 1.000 | 0.000 | 0.000 | 0.000 | 0.000 | 0.000 | 0.000 | ||
| 1 spectrum, TAFLNQDLDLLLR | 0.000 | 1.000 | 0.000 | 0.000 | 0.000 | 0.000 | 0.000 | 0.000 | ||
| 13 spectra, MGNLHTWDGPLPR | 0.037 | 0.892 | 0.000 | 0.000 | 0.000 | 0.000 | 0.072 | 0.000 | ||
| 1 spectrum, SVFPLEQAFINNK | 0.135 | 0.865 | 0.000 | 0.000 | 0.000 | 0.000 | 0.000 | 0.000 | ||
| 5 spectra, YDLLDVTR | 0.056 | 0.944 | 0.000 | 0.000 | 0.000 | 0.000 | 0.000 | 0.000 | ||
| 2 spectra, LLGPGPAADFLVSVER | 0.012 | 0.988 | 0.000 | 0.000 | 0.000 | 0.000 | 0.000 | 0.000 | ||
| 5 spectra, SFGMTPVLPAFAGHVPK | 0.054 | 0.946 | 0.000 | 0.000 | 0.000 | 0.000 | 0.000 | 0.000 | ||
| 5 spectra, GIPFQQHQFEK | 0.023 | 0.977 | 0.000 | 0.000 | 0.000 | 0.000 | 0.000 | 0.000 | ||
| 4 spectra, QLYLQHR | 0.015 | 0.916 | 0.000 | 0.000 | 0.000 | 0.000 | 0.069 | 0.000 | ||
| 1 spectrum, AGGLLTYK | 0.000 | 0.822 | 0.000 | 0.000 | 0.000 | 0.045 | 0.133 | 0.000 |
| Plot | Mito | Lyso or Perox | ER | Golgi | PM | Cytosol | Nucleus | ||||||
| Expt B |
8 peptides |
20 spectra |
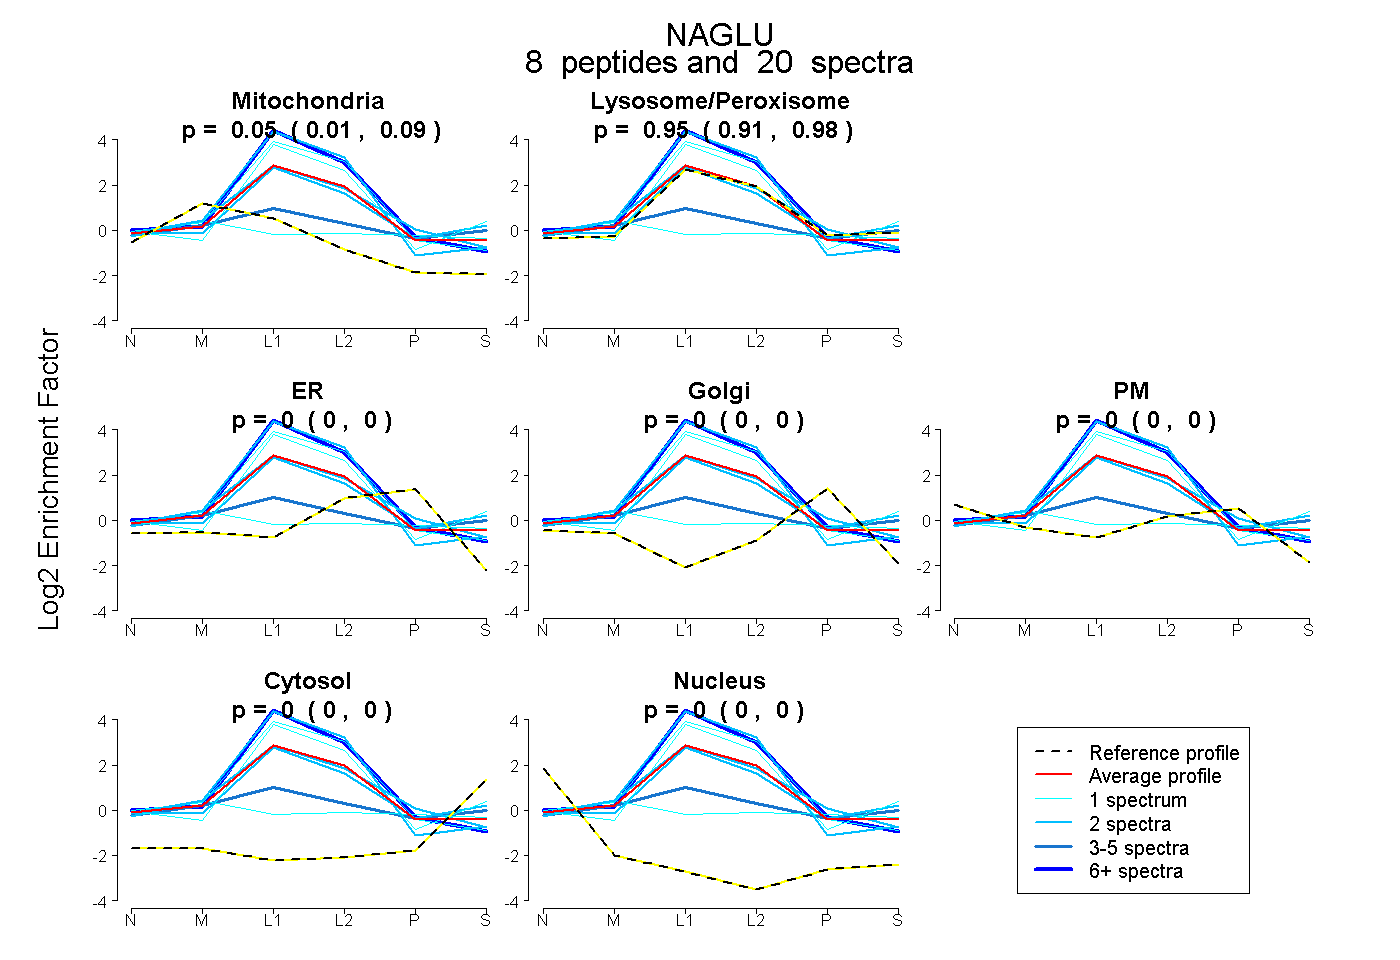 |
0.055 0.013 | 0.085 |
0.945 0.909 | 0.978 |
0.000 0.000 | 0.000 |
0.000 0.000 | 0.000 |
0.000 0.000 | 0.000 |
0.000 0.000 | 0.000 |
0.000 0.000 | 0.000 |
|||
| Plot | Lyso | Other | |||||||||||
| Expt C |
18 peptides |
181 spectra |
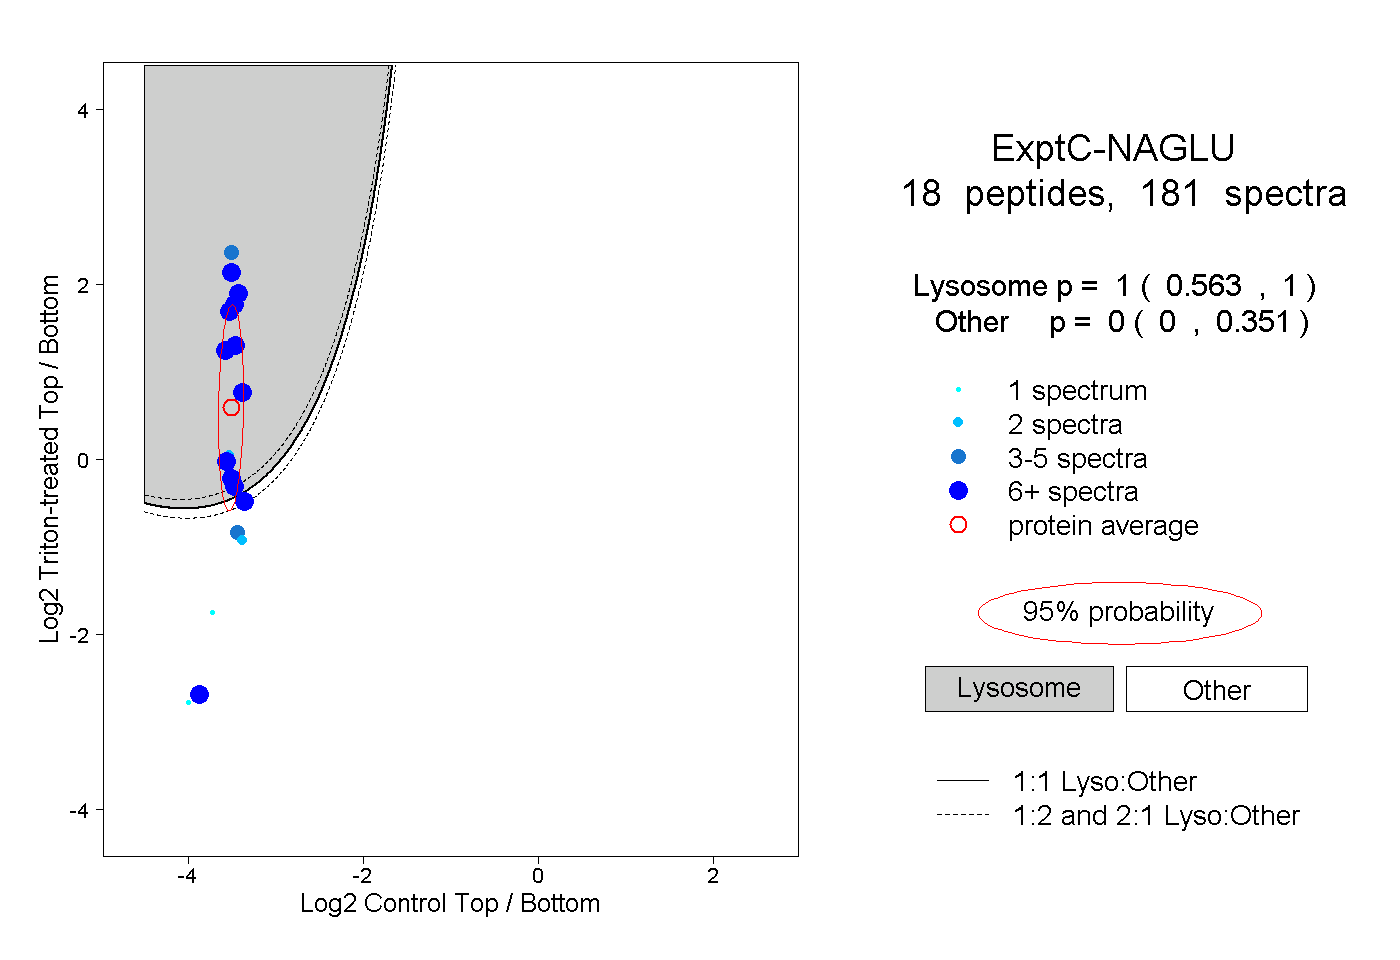 |
1.000 0.563 | 1.000 |
0.000 0.000 | 0.351 |
||||||||
| Plot | Lyso | Other | |||||||||||
| Expt D |
10 peptides |
31 spectra |
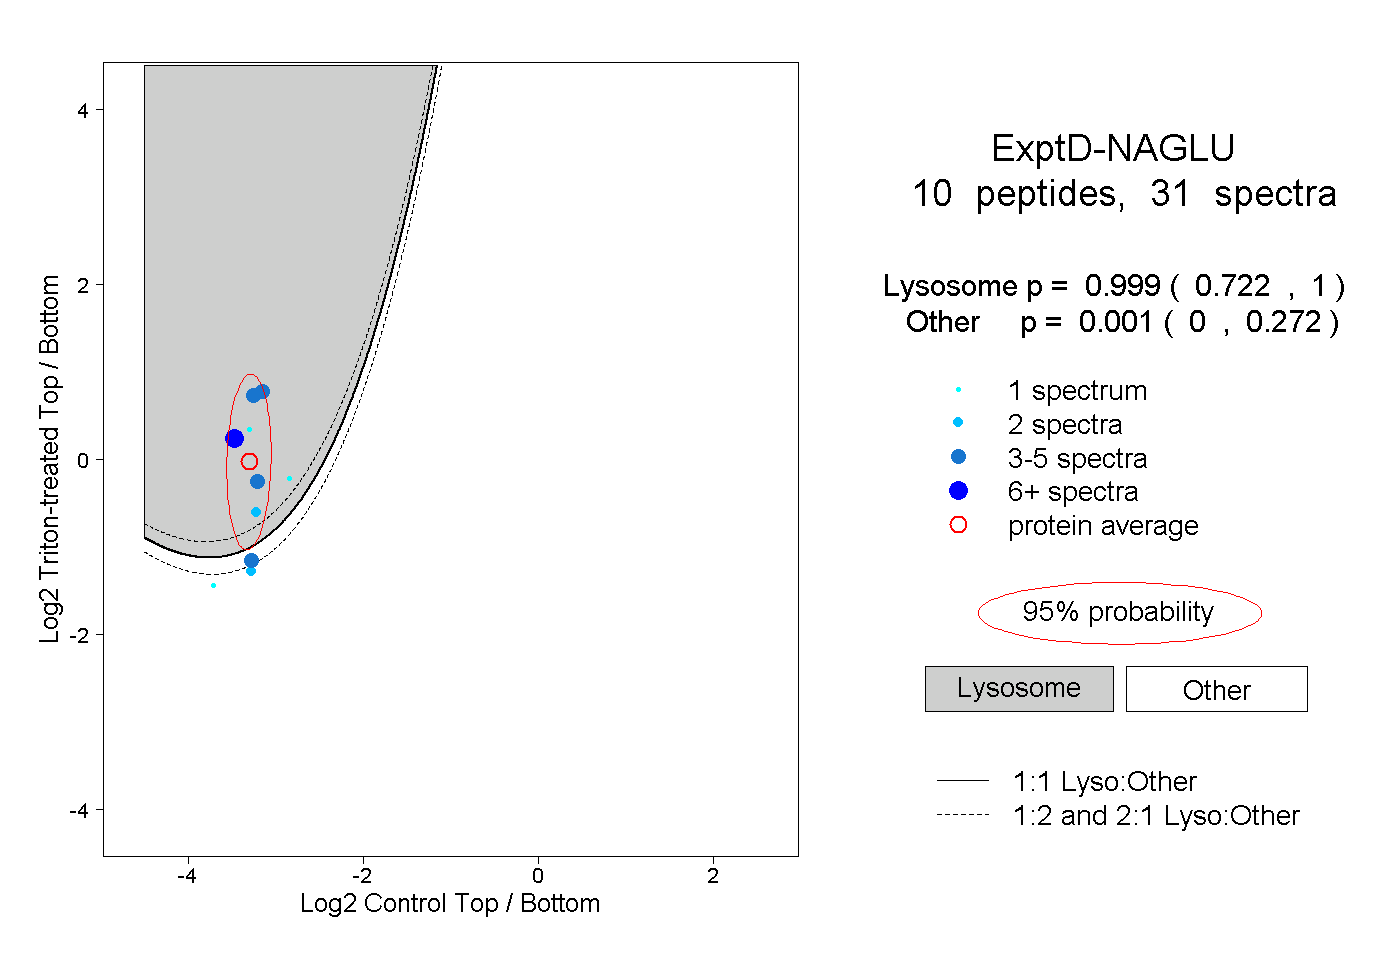 |
0.999 0.722 | 1.000 |
0.001 0.000 | 0.272 |