 11
11peptides
spectra
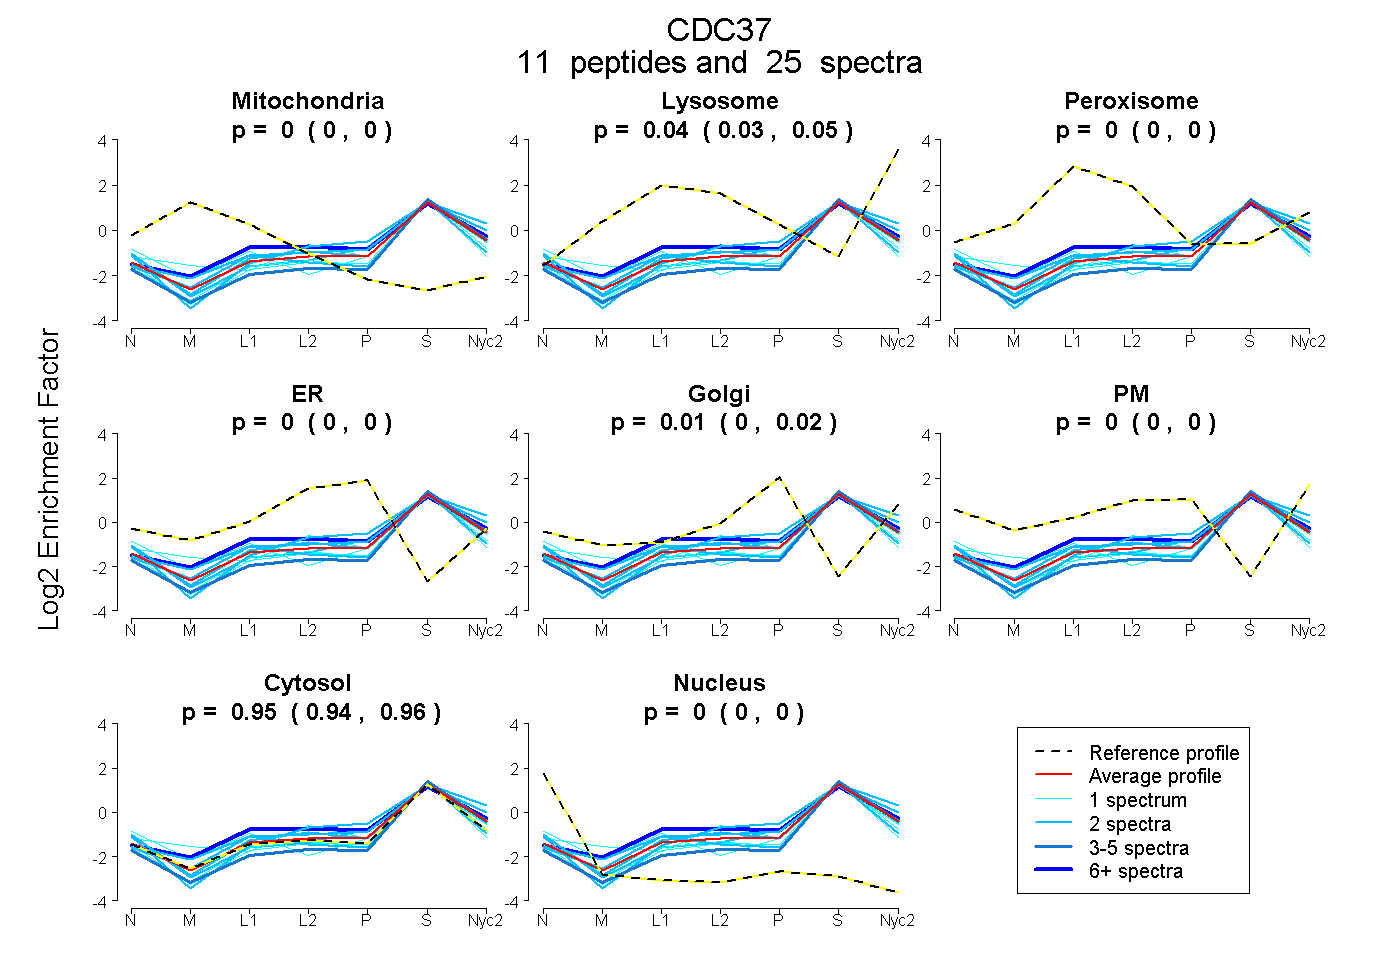
0.000 | 0.000
0.026 | 0.046
0.000 | 0.000
0.000 | 0.000
0.003 | 0.021
0.000 | 0.000
0.943 | 0.956
0.000 | 0.000
1peptide
spectrum
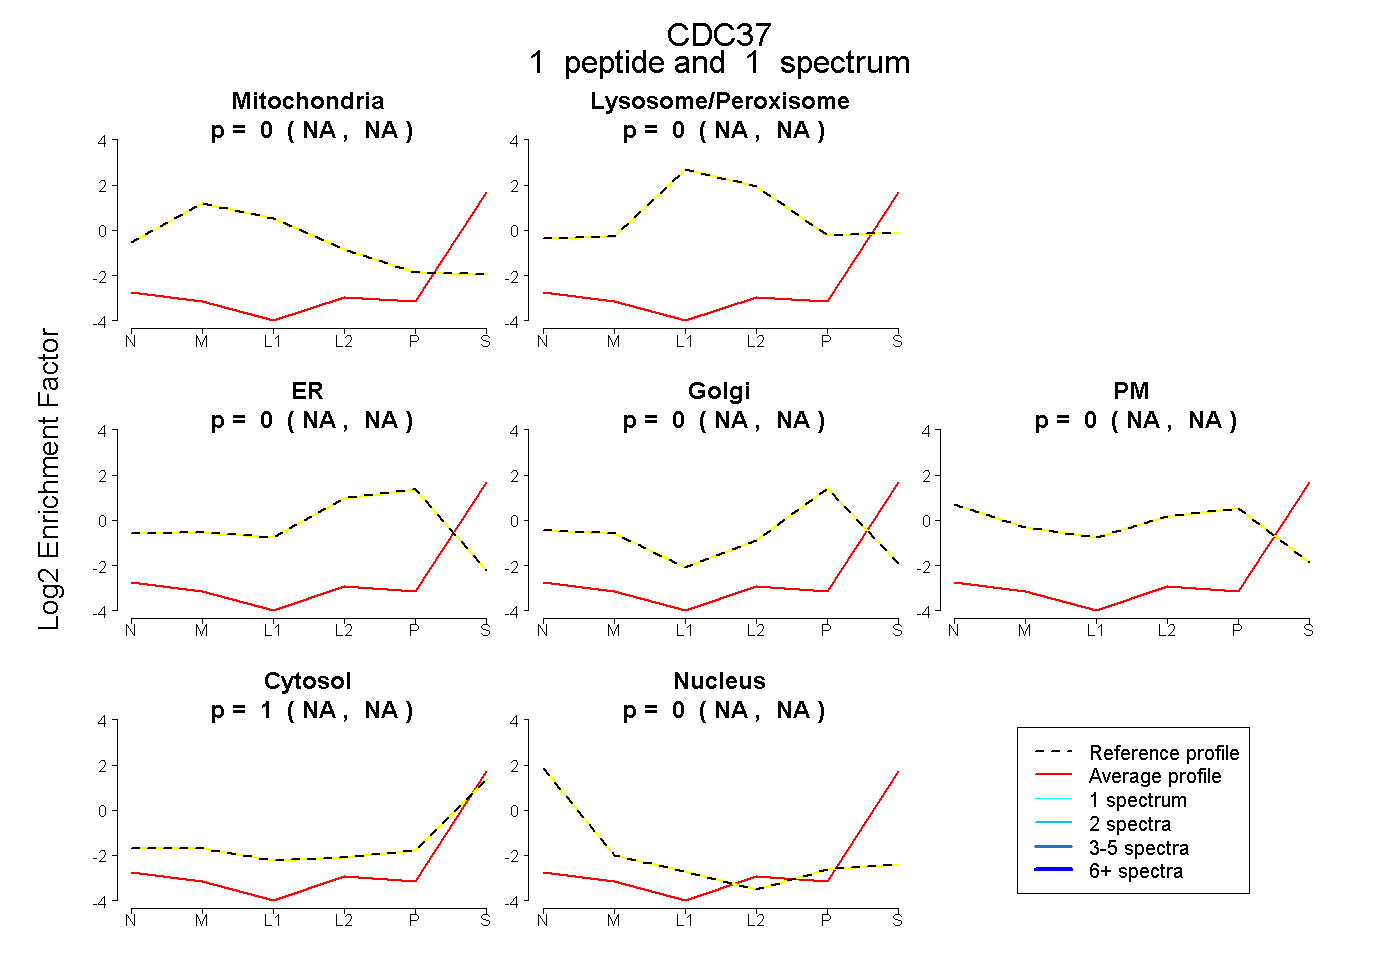
NA | NA
NA | NA
NA | NA
NA | NA
NA | NA
NA | NA
NA | NA
7peptides
spectra
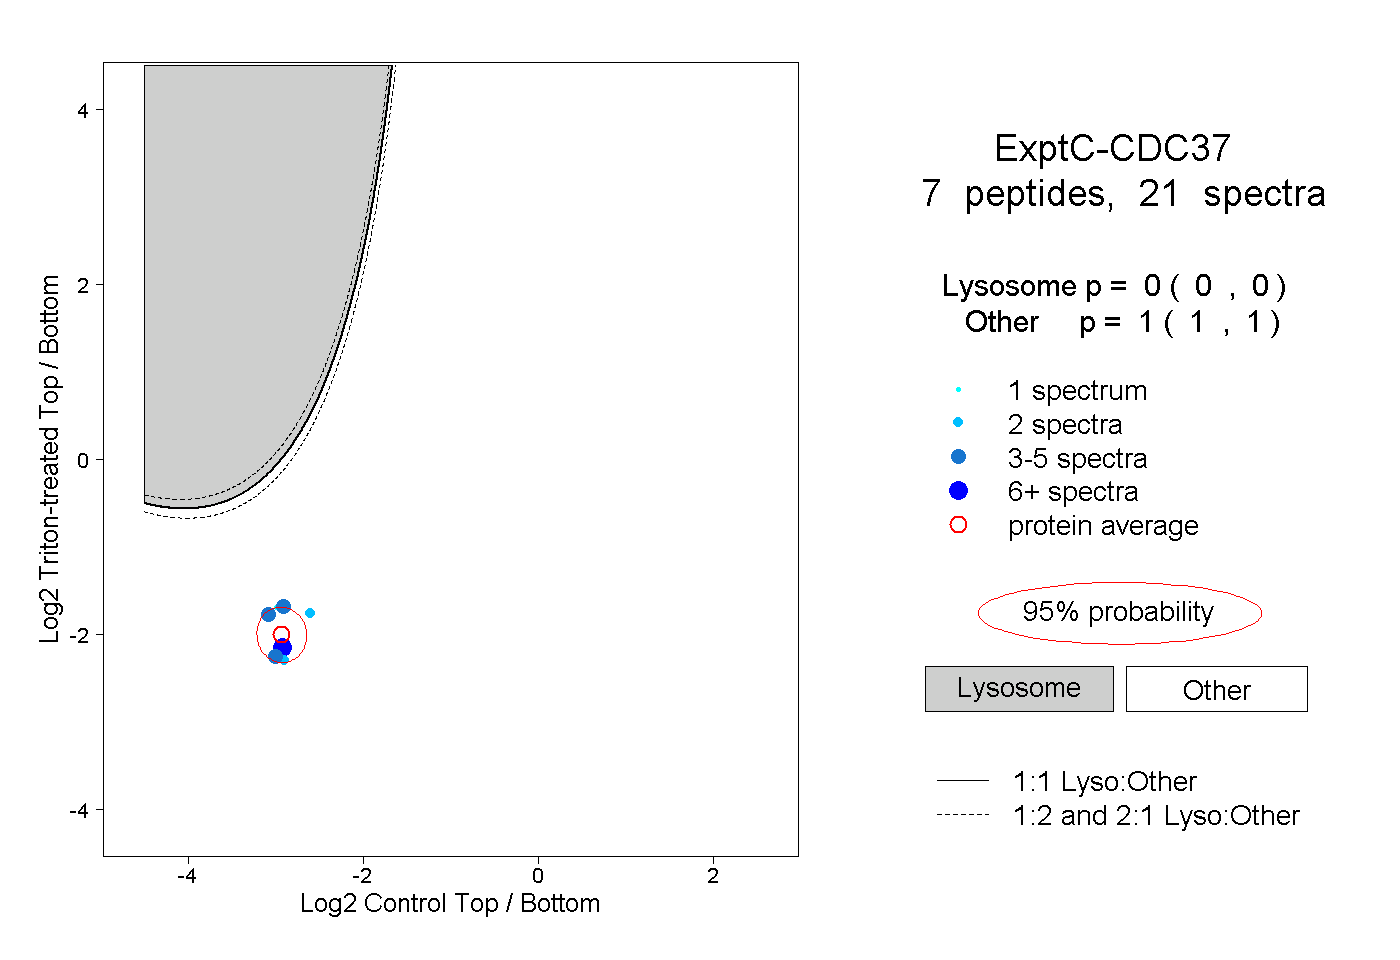
0.000 | 0.000
1.000 | 1.000
1peptide
spectrum
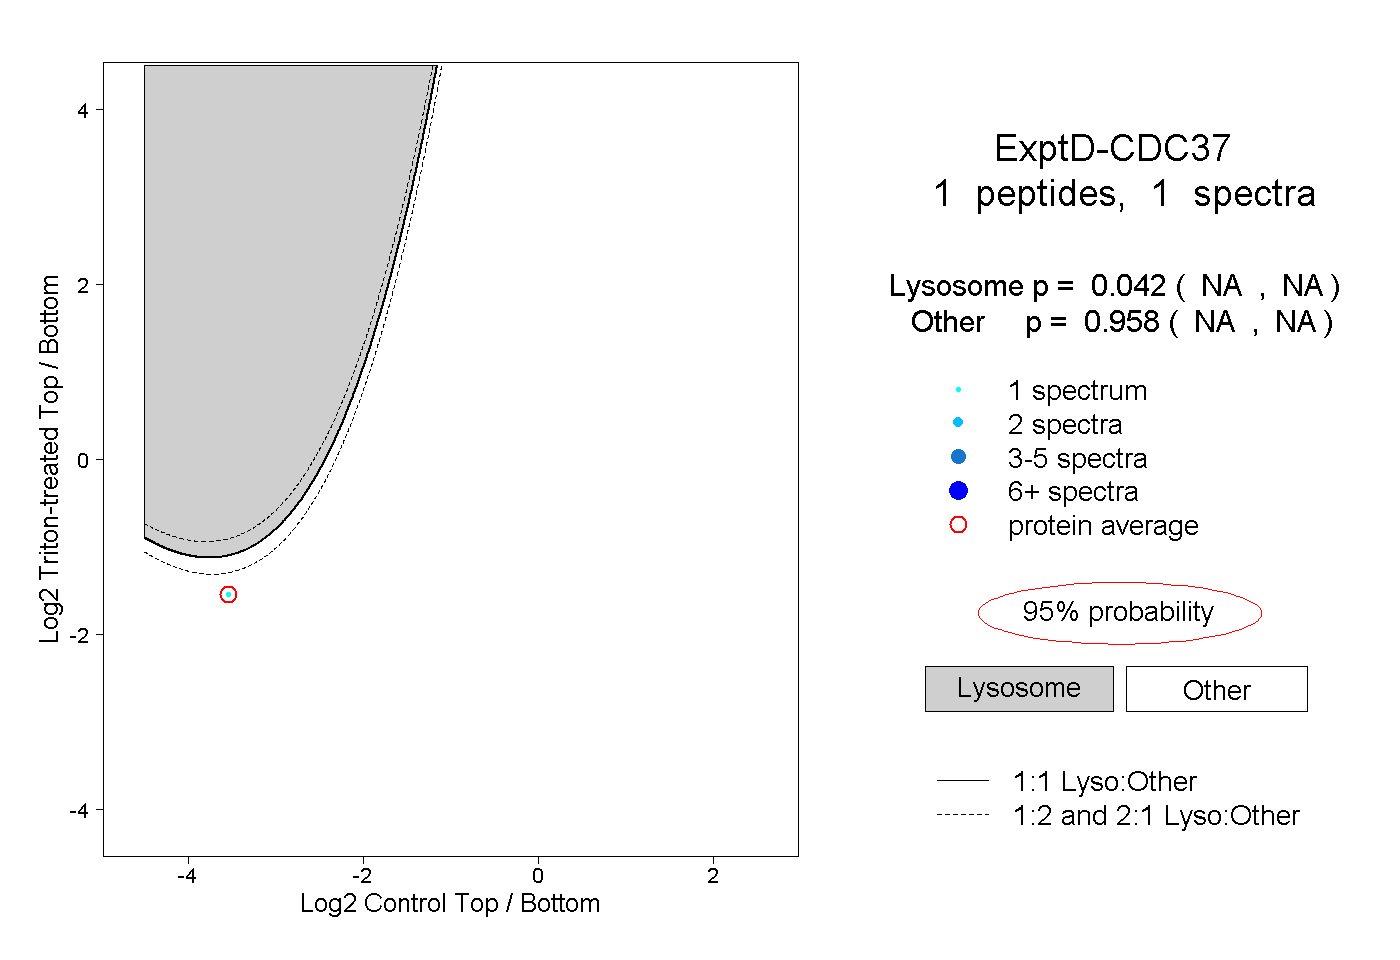
NA | NA
NA | NA