 1
1peptide
spectra
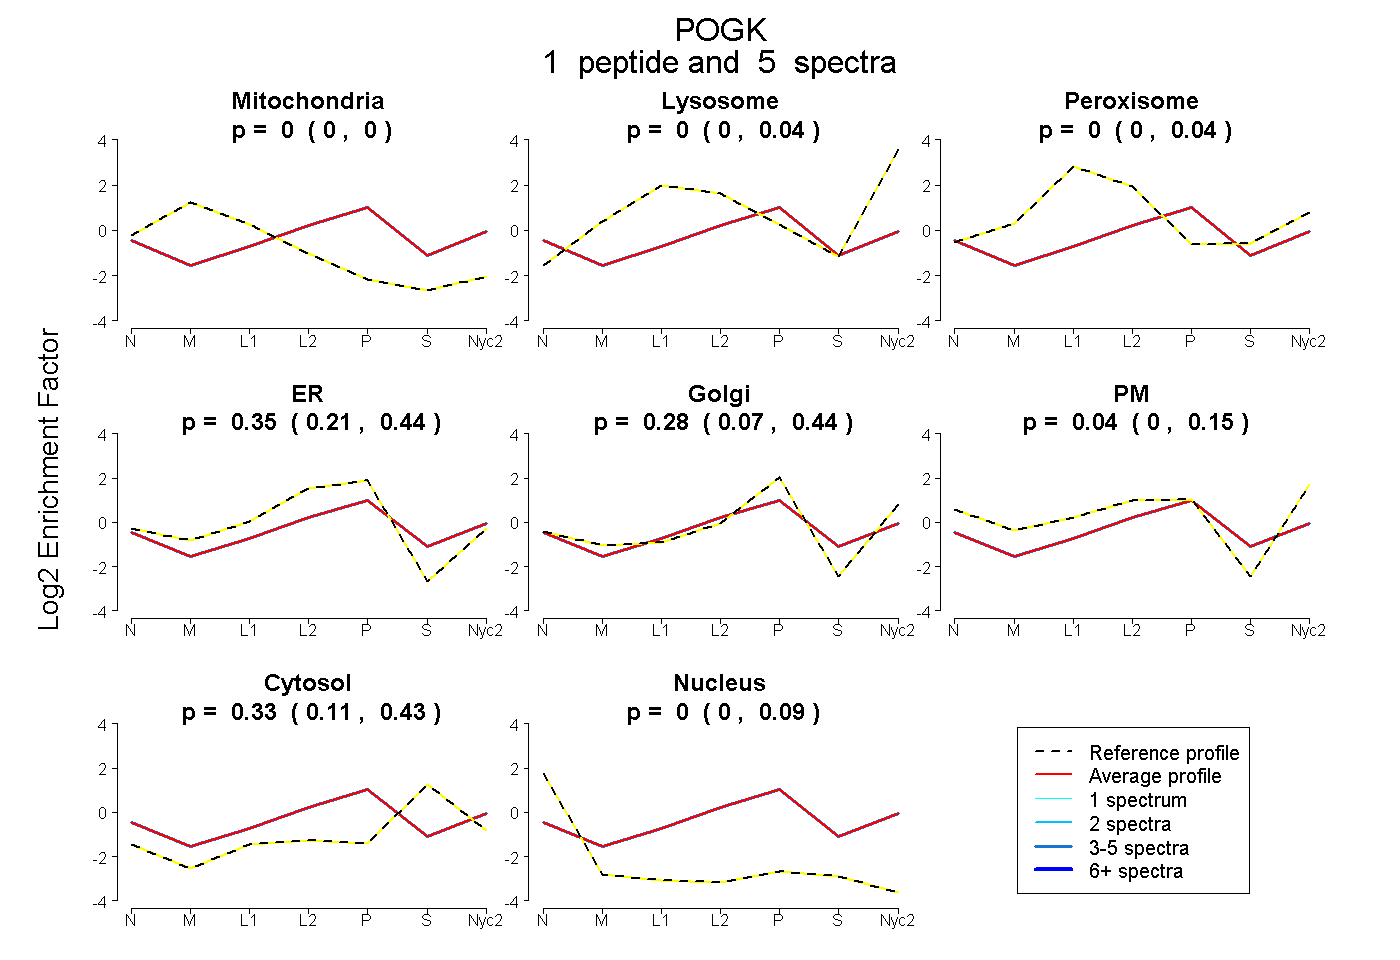
0.000 | 0.000
0.000 | 0.037
0.000 | 0.039
0.213 | 0.439
0.066 | 0.440
0.000 | 0.154
0.114 | 0.428
0.000 | 0.085
1peptide
spectra
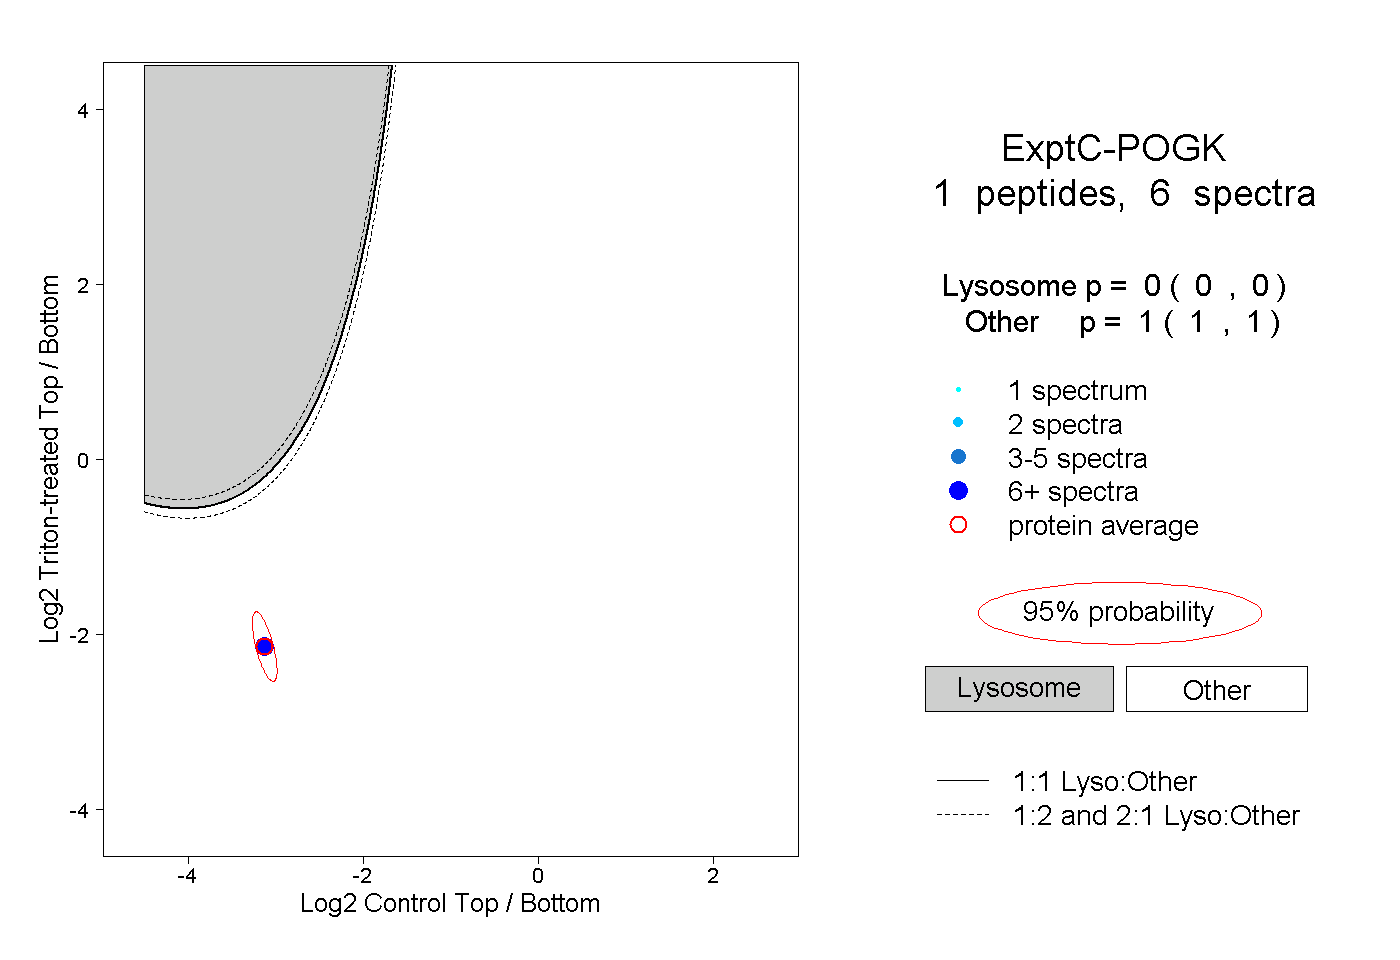
0.000 | 0.000
1.000 | 1.000
1peptide
spectrum
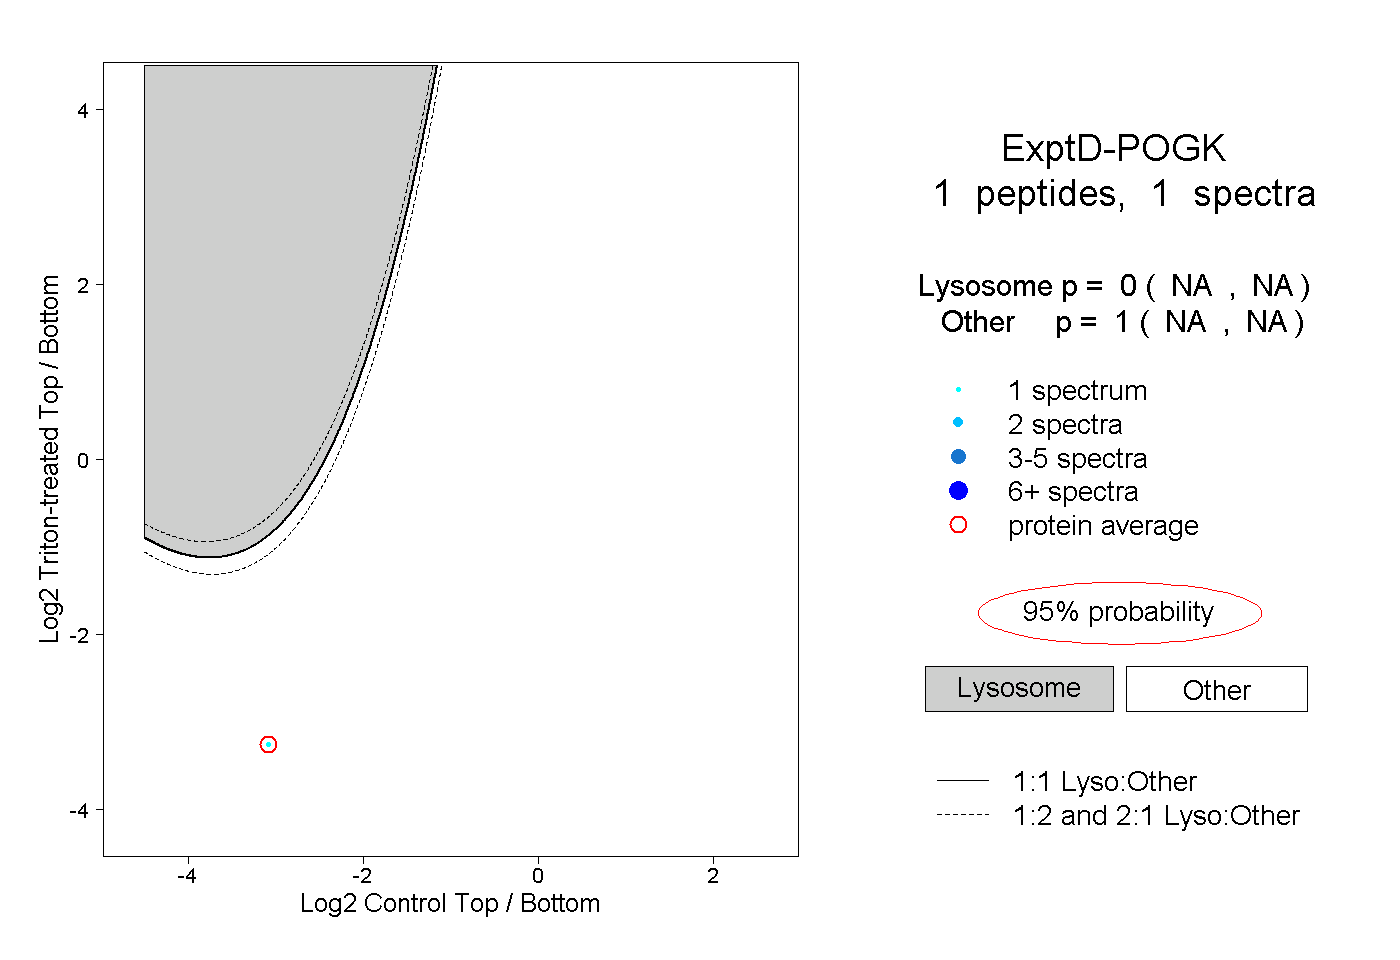
NA | NA
NA | NA