 3
3peptides
spectra
0.000 | 0.000
0.000 | 0.000
0.000 | 0.140
0.000 | 0.103
0.000 | 0.000
0.000 | 0.113
0.234 | 0.307
0.540 | 0.616
1peptide
spectrum
NA | NA
NA | NA
NA | NA
NA | NA
NA | NA
NA | NA
NA | NA
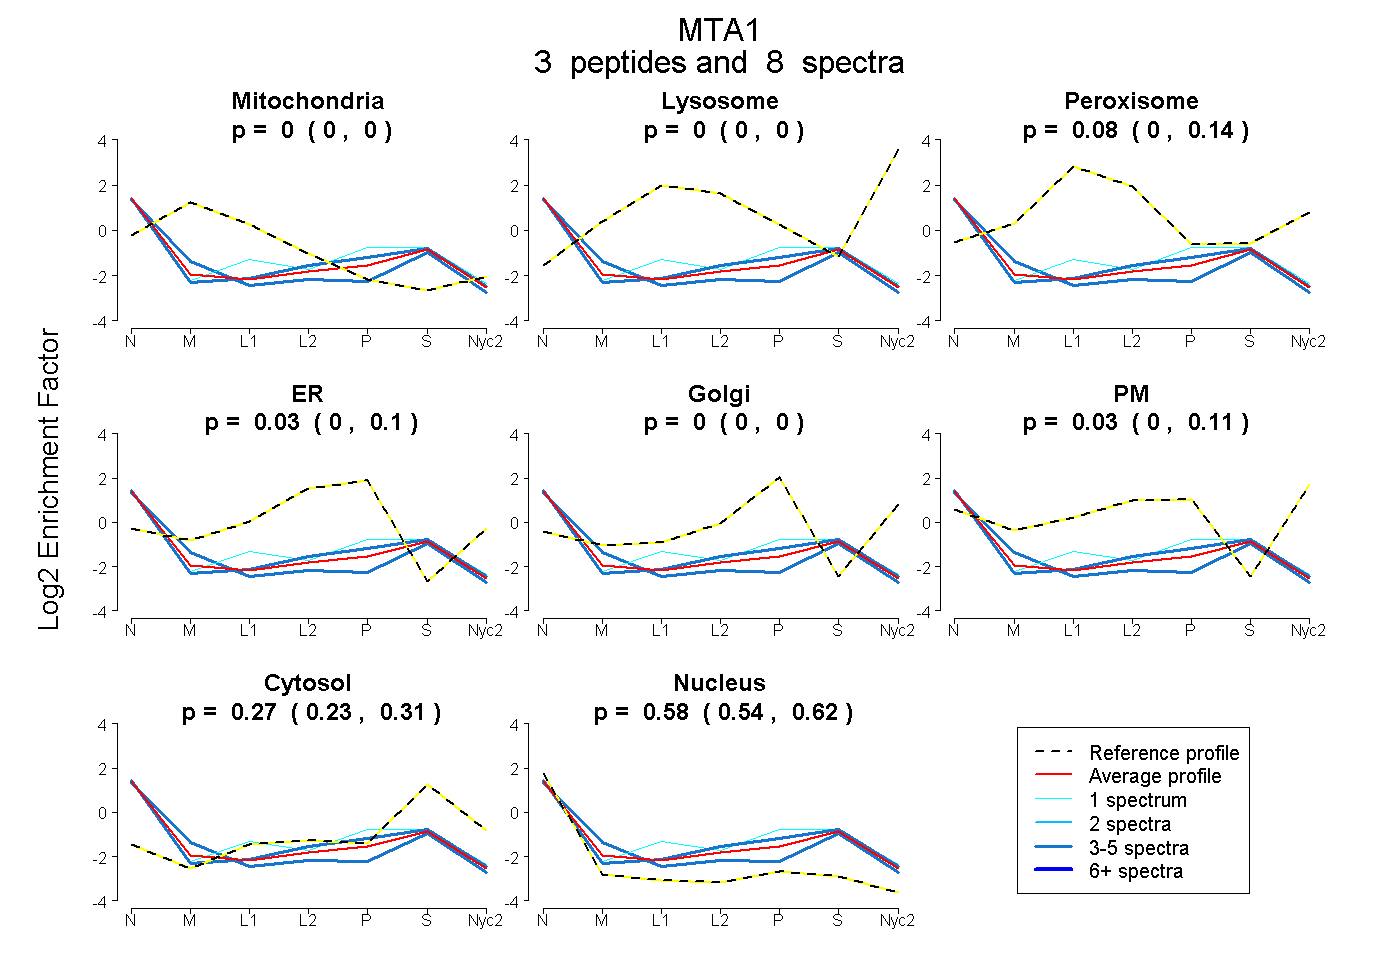
| Plot | Mito | Lyso | Perox | ER | Golgi | PM | Cytosol | Nucleus | |||||
| Expt A |
3 peptides |
8 spectra |
|
0.000 0.000 | 0.000 |
0.000 0.000 | 0.000 |
0.083 0.000 | 0.140 |
0.033 0.000 | 0.103 |
0.000 0.000 | 0.000 |
0.026 0.000 | 0.113 |
0.274 0.234 | 0.307 |
0.584 0.540 | 0.616 |
||
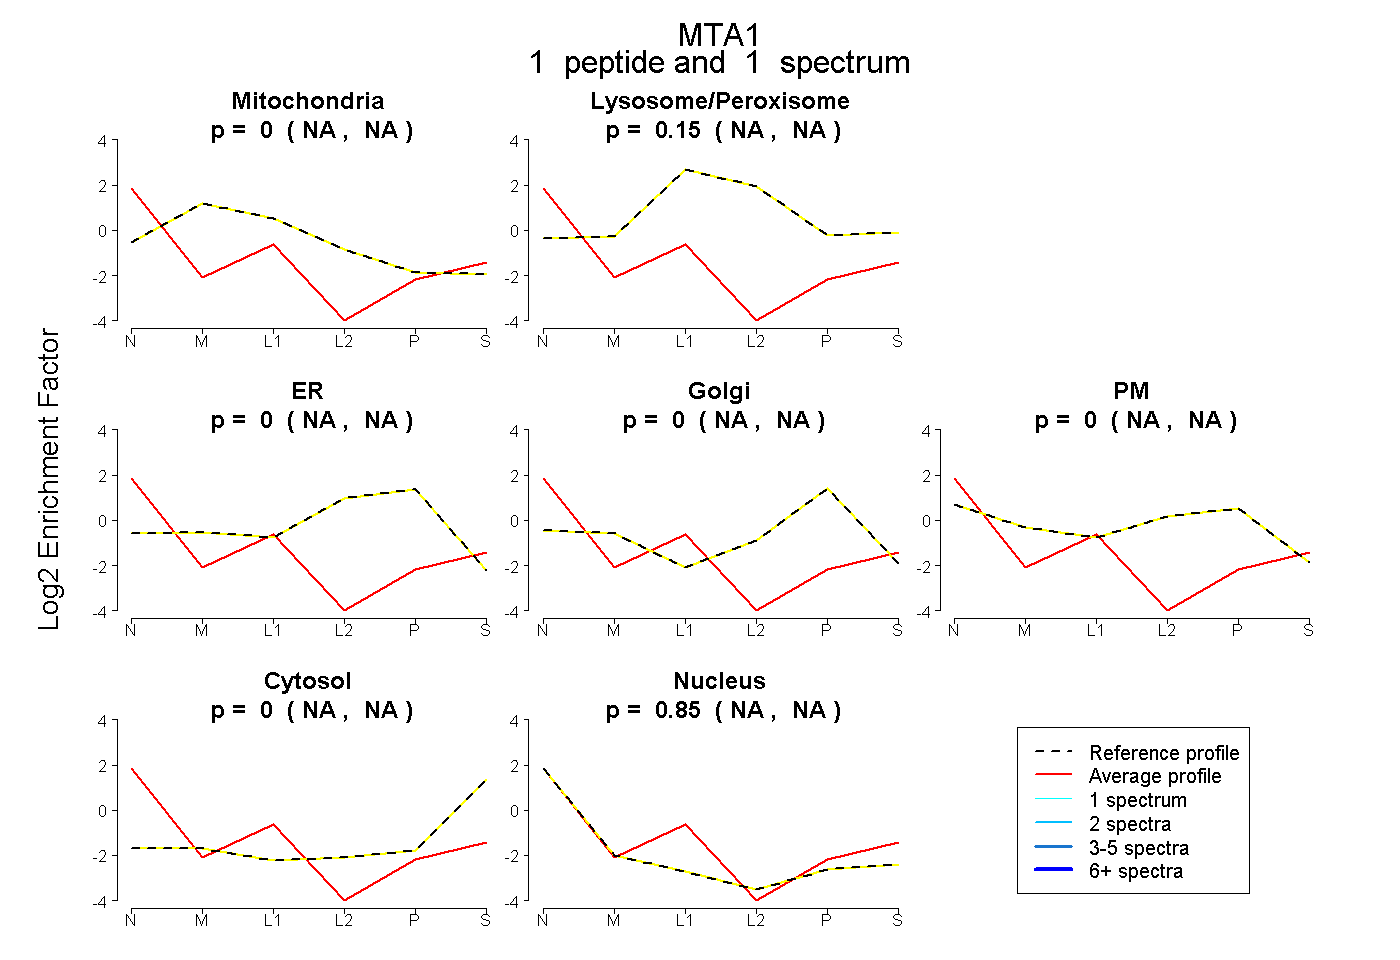
| Plot | Mito | Lyso or Perox | ER | Golgi | PM | Cytosol | Nucleus | ||||||
| Expt B |
1 peptide |
1 spectrum |
|
0.000 NA | NA |
0.148 NA | NA |
0.000 NA | NA |
0.000 NA | NA |
0.000 NA | NA |
0.000 NA | NA |
0.852 NA | NA |