 2
2peptides
spectra
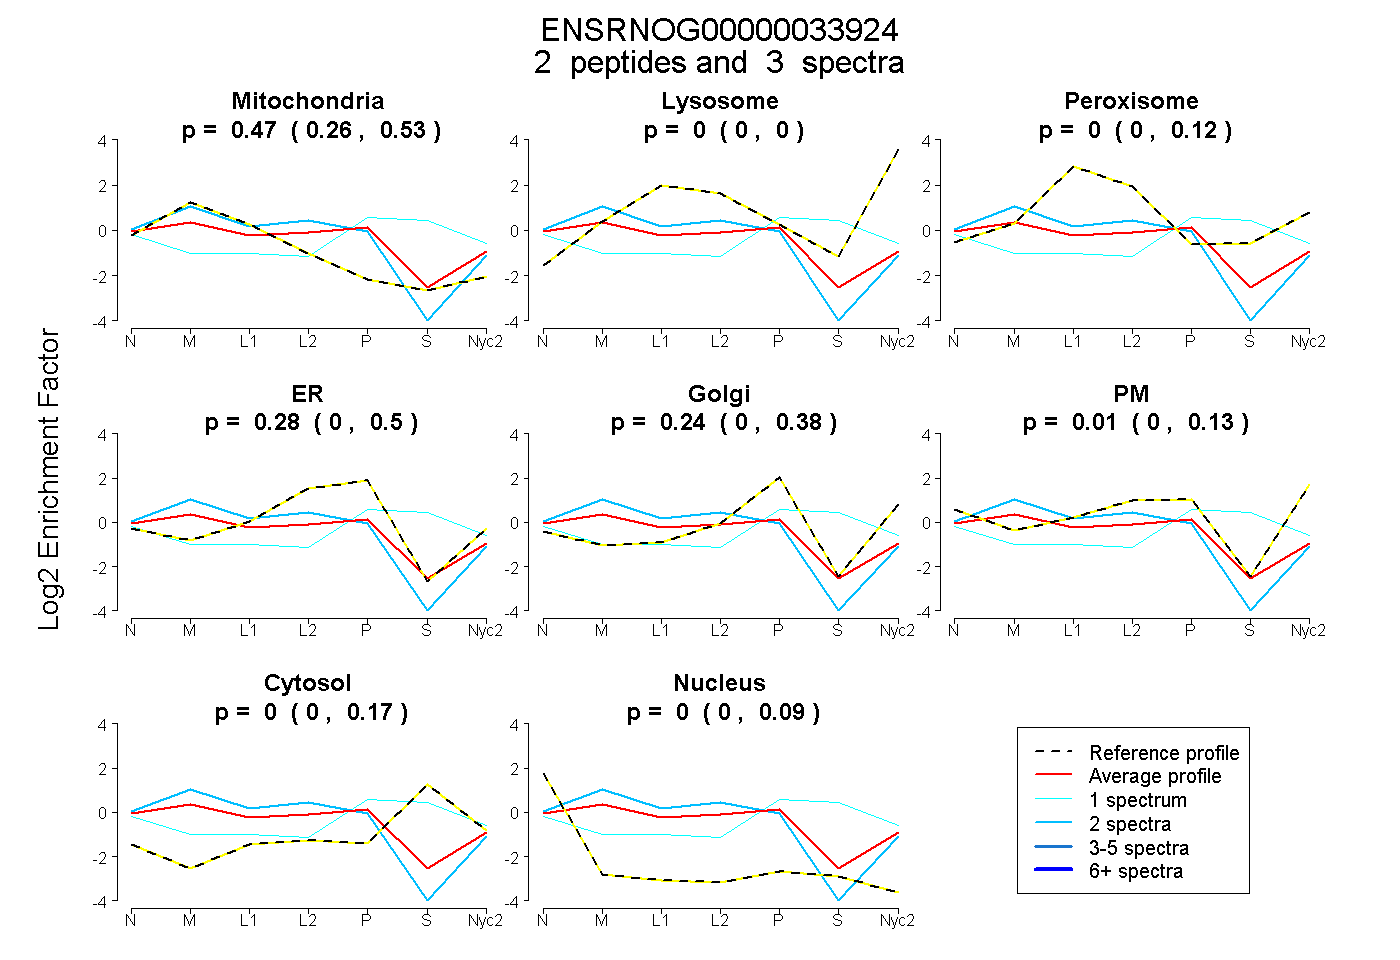
0.261 | 0.533
0.000 | 0.000
0.000 | 0.122
0.000 | 0.503
0.000 | 0.384
0.000 | 0.128
0.000 | 0.165
0.000 | 0.091
1peptide
spectrum
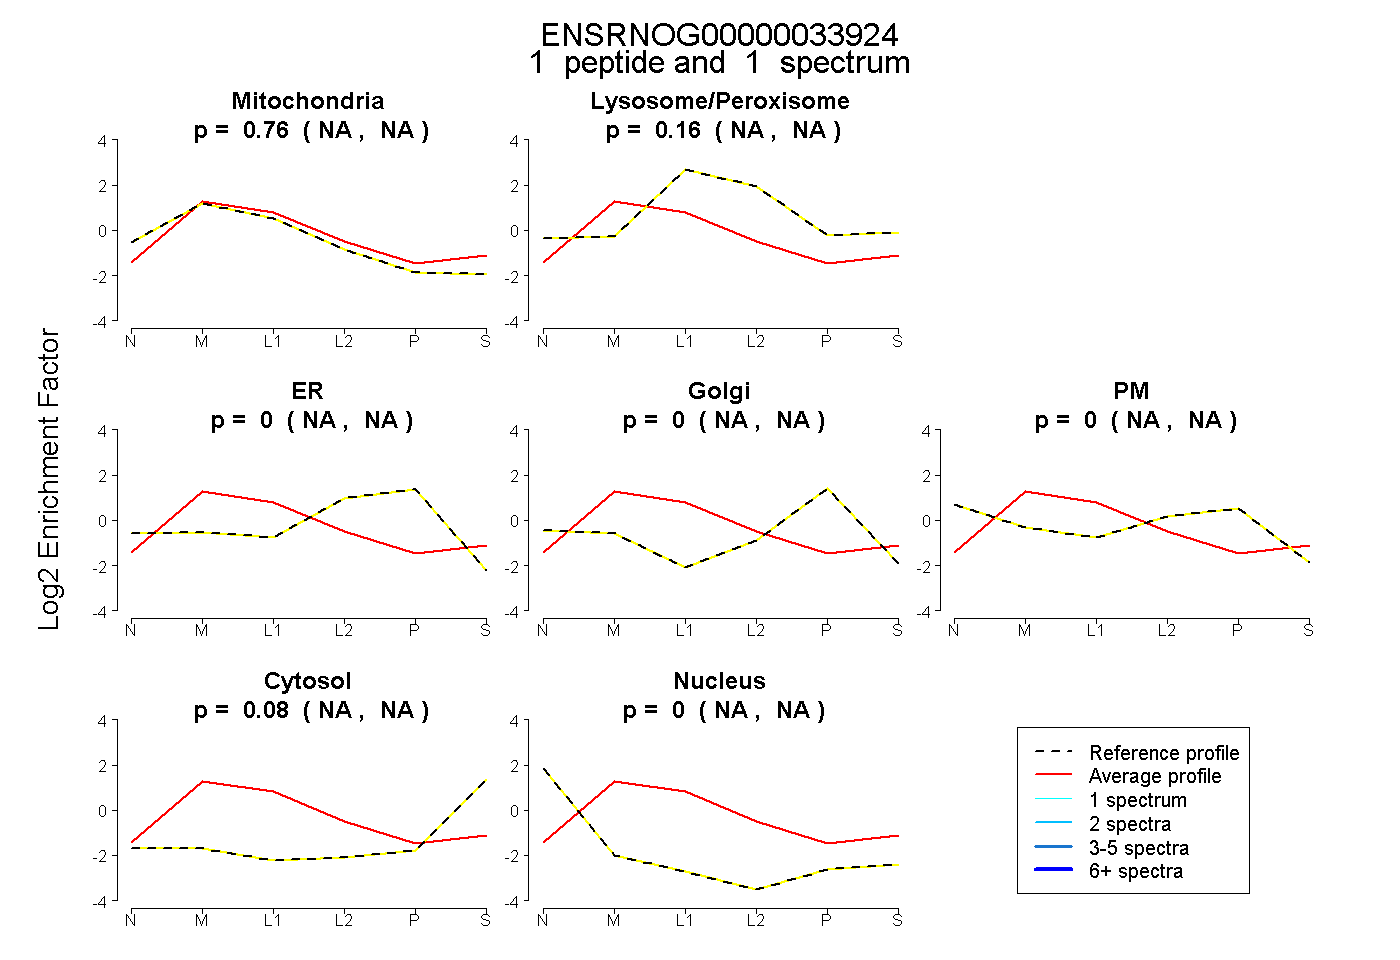
NA | NA
NA | NA
NA | NA
NA | NA
NA | NA
NA | NA
NA | NA
2peptides
spectra

0.000 | 0.000
1.000 | 1.000