 3
3peptides
spectra
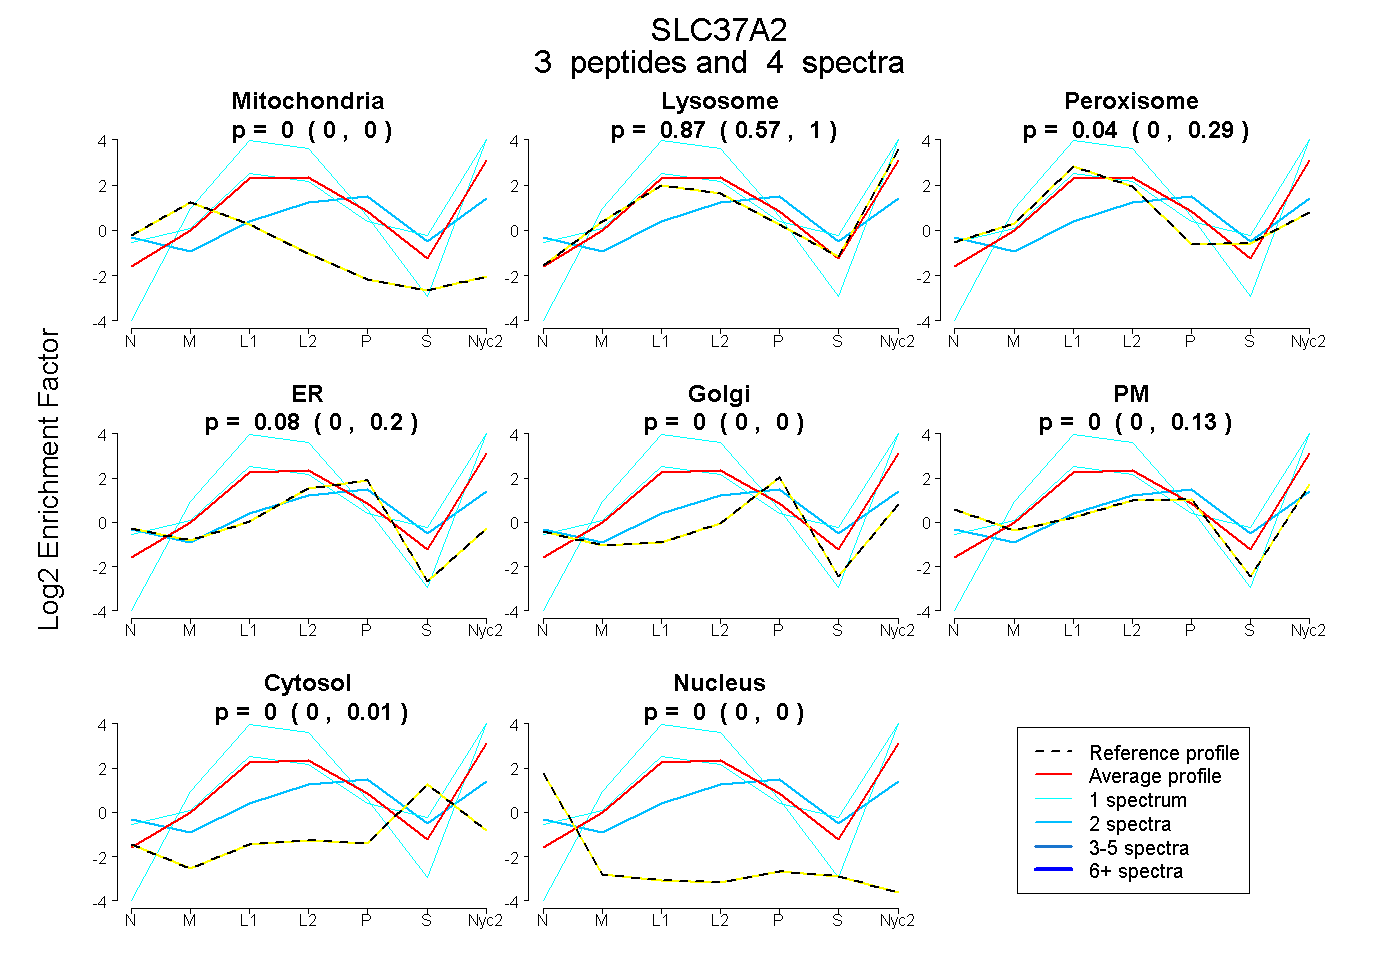
0.000 | 0.000
0.572 | 1.000
0.000 | 0.289
0.000 | 0.199
0.000 | 0.000
0.000 | 0.131
0.000 | 0.010
0.000 | 0.000
1peptide
spectrum
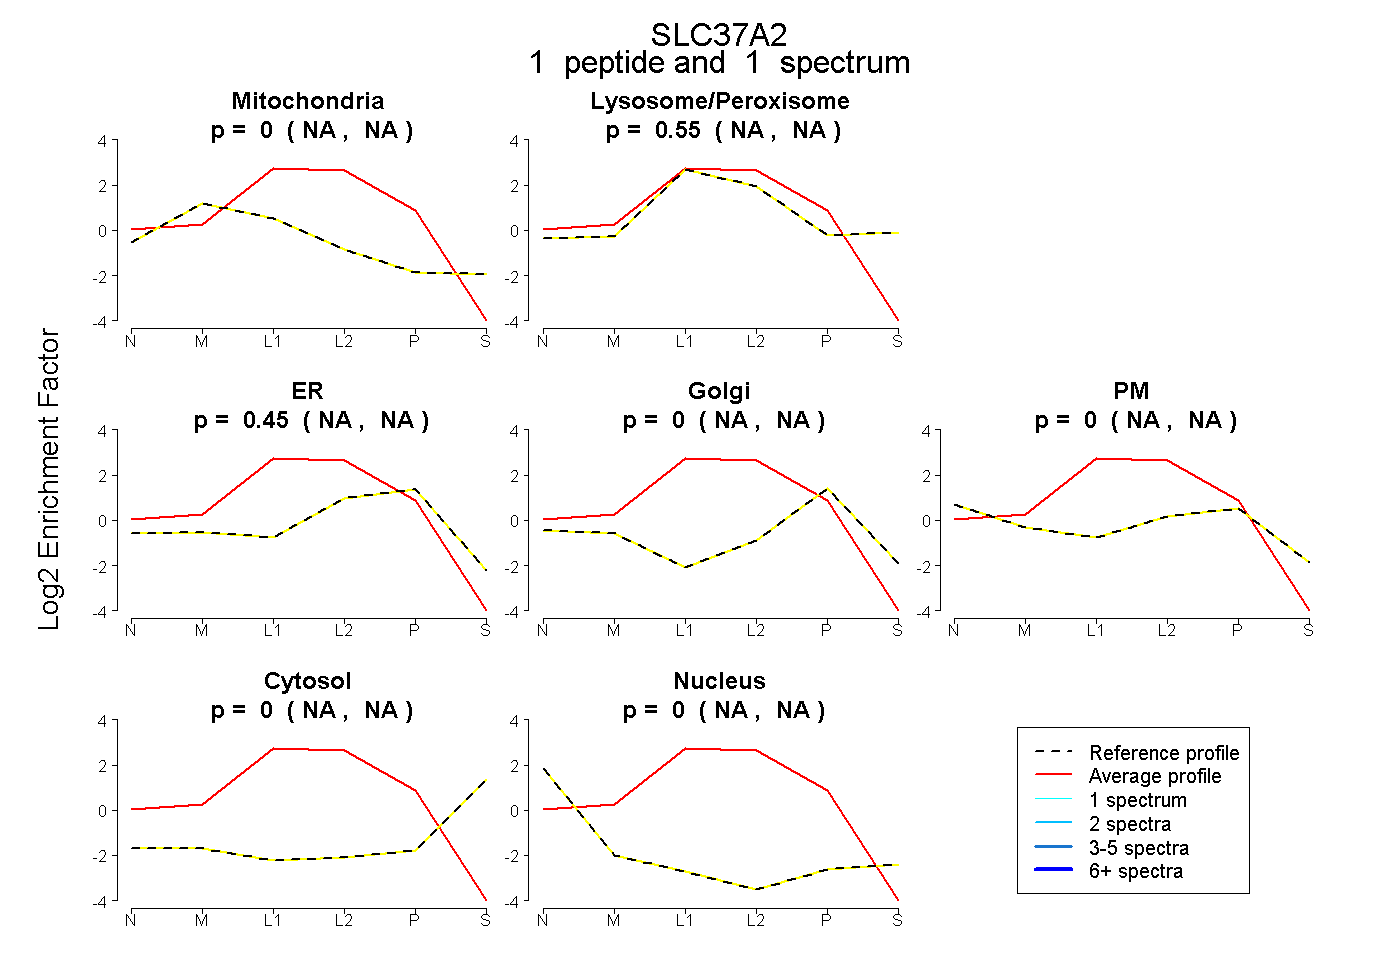
NA | NA
NA | NA
NA | NA
NA | NA
NA | NA
NA | NA
NA | NA
4peptides
spectra
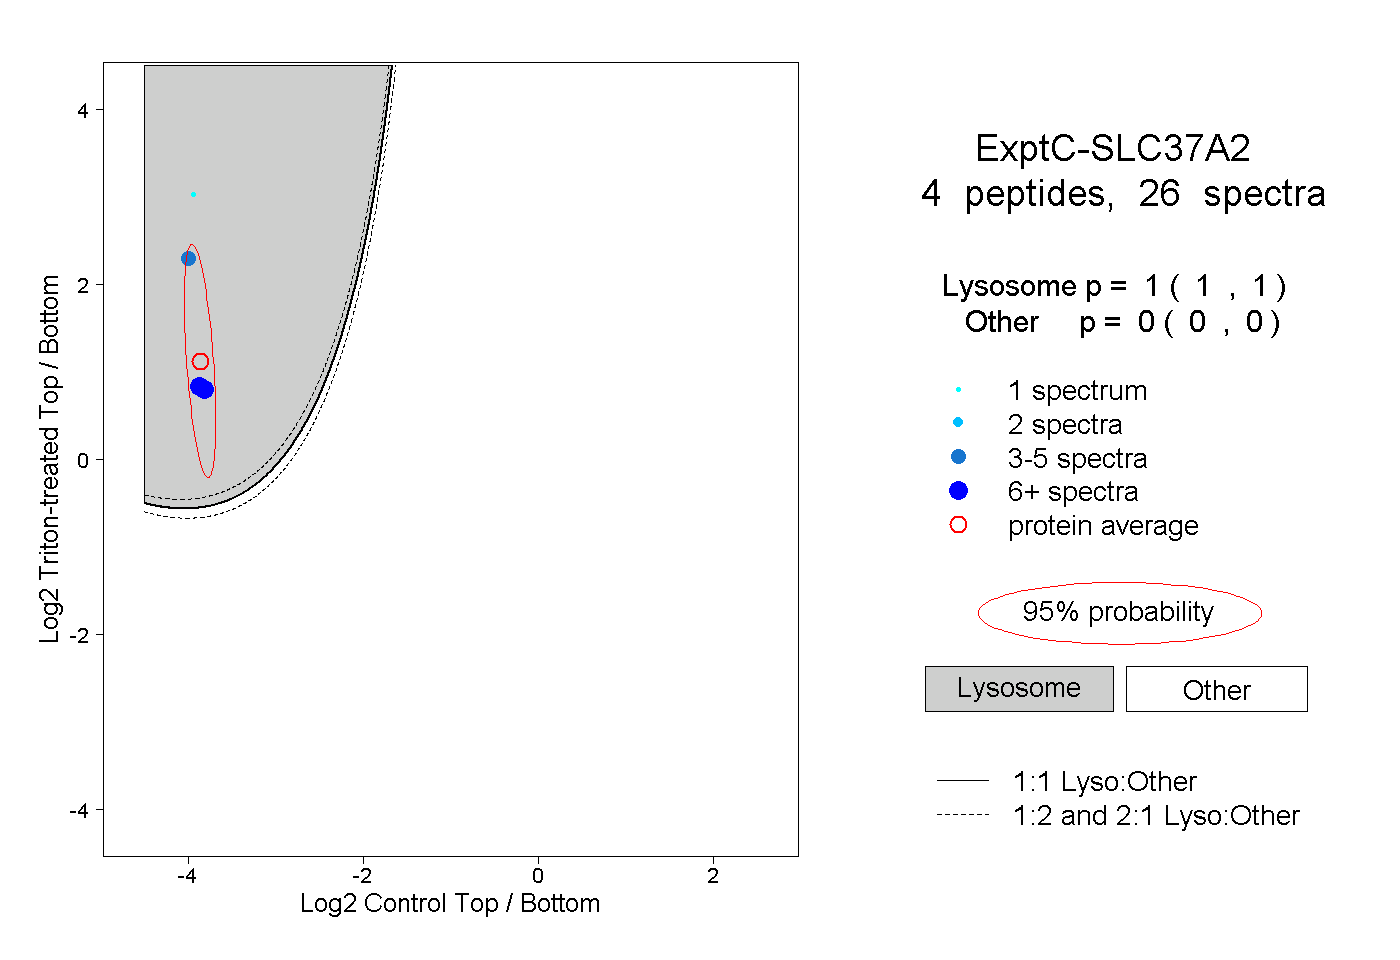
1.000 | 1.000
0.000 | 0.000
1peptide
spectrum
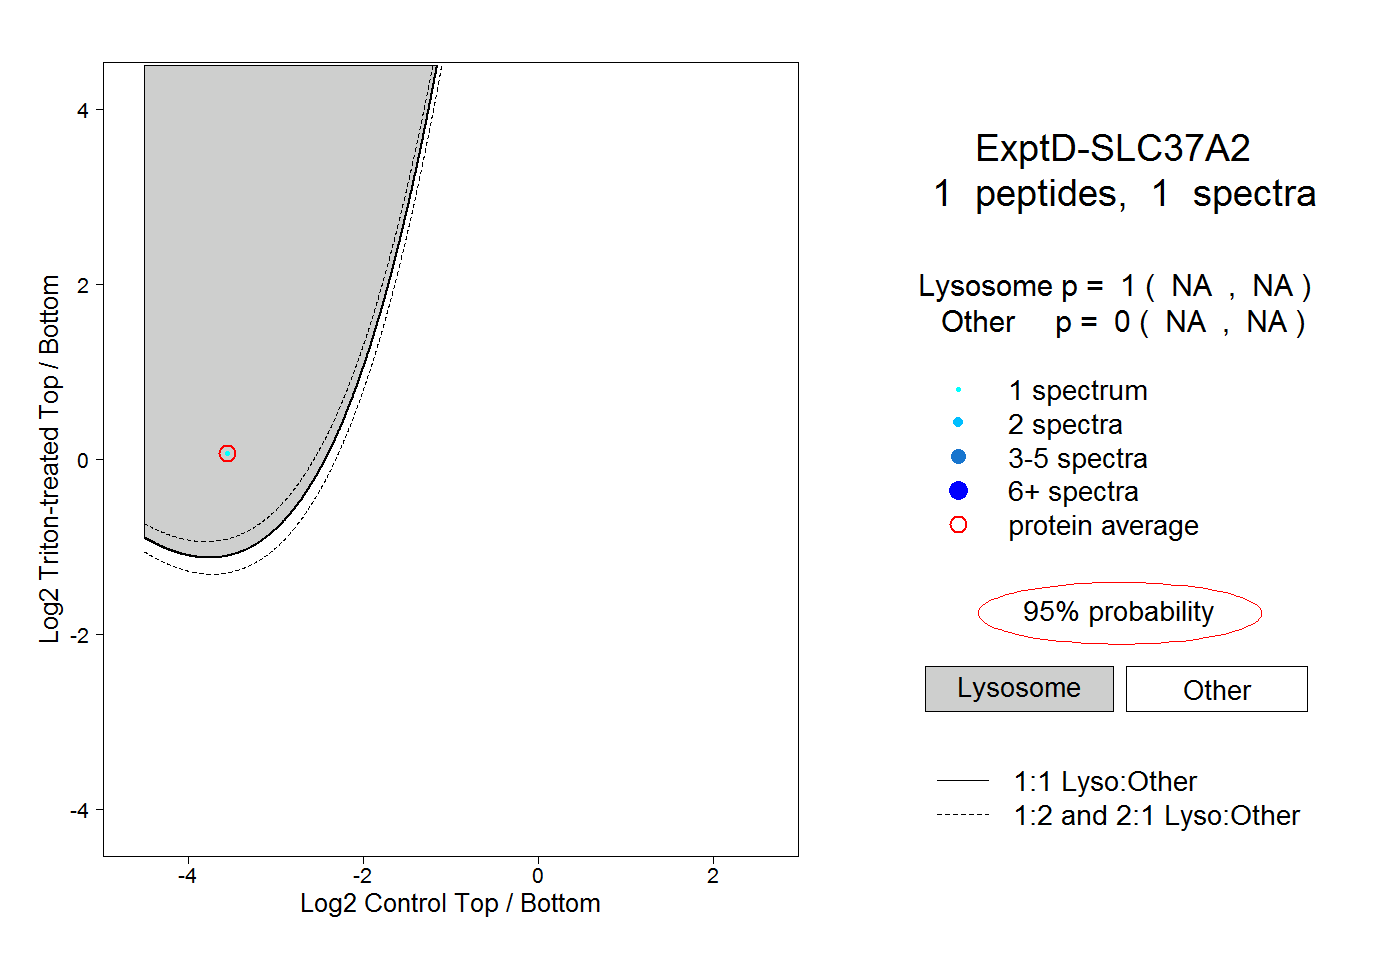
NA | NA
NA | NA