 1
1peptide
spectrum
NA | NA
NA | NA
NA | NA
NA | NA
NA | NA
NA | NA
NA | NA
NA | NA
4peptides
spectra
0.000 | 0.811
0.182 | 1.000
| Plot | Mito | Lyso | Perox | ER | Golgi | PM | Cytosol | Nucleus | |||||
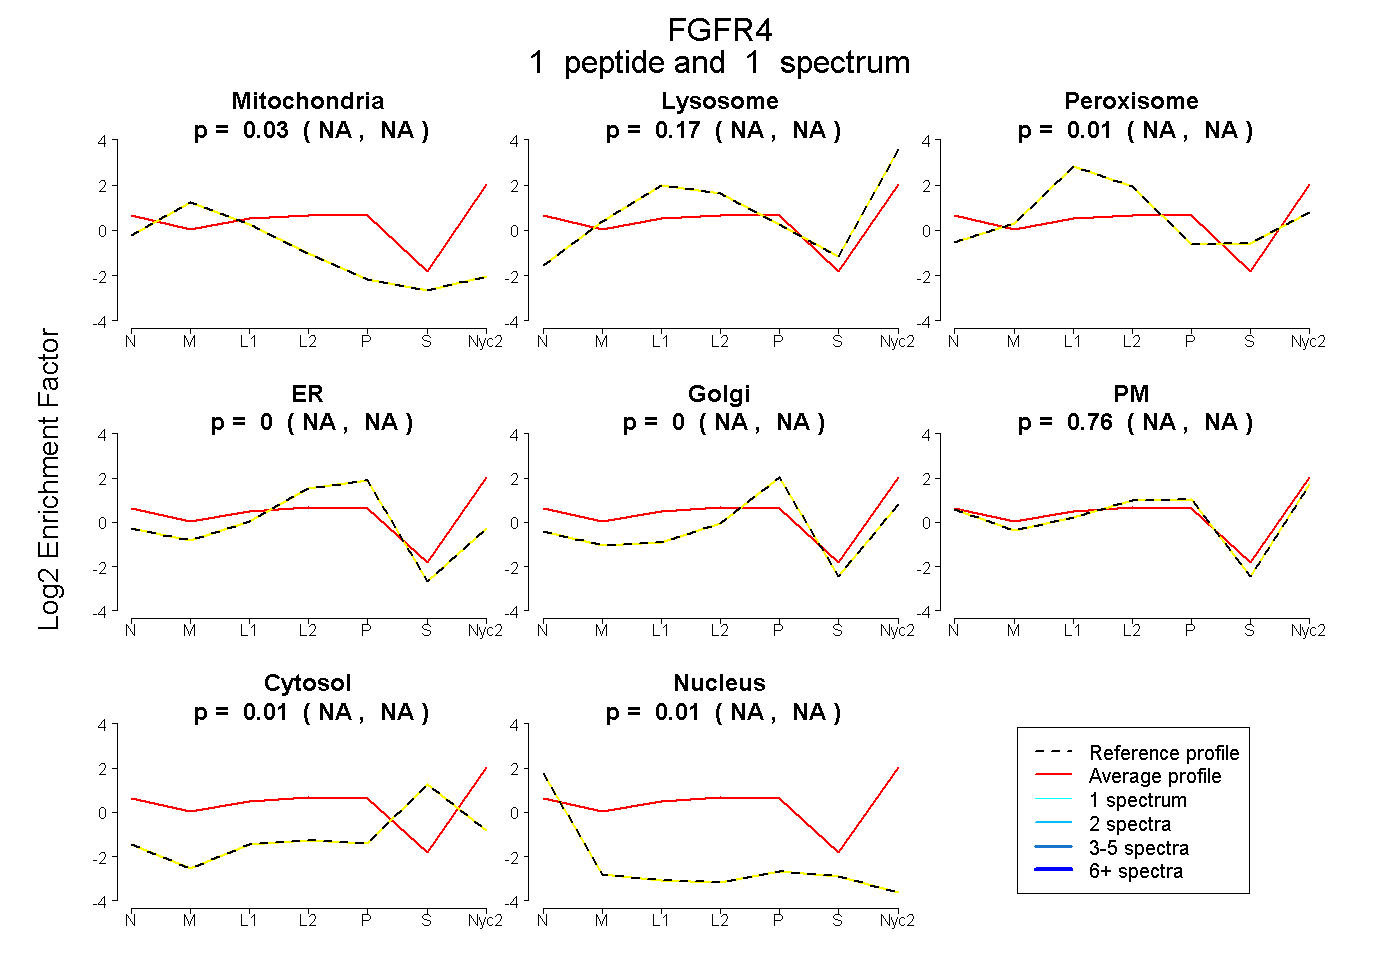
| Expt A |
1 peptide |
1 spectrum |
|
0.030 NA | NA |
0.174 NA | NA |
0.012 NA | NA |
0.000 NA | NA |
0.000 NA | NA |
0.760 NA | NA |
0.012 NA | NA |
0.013 NA | NA |
||
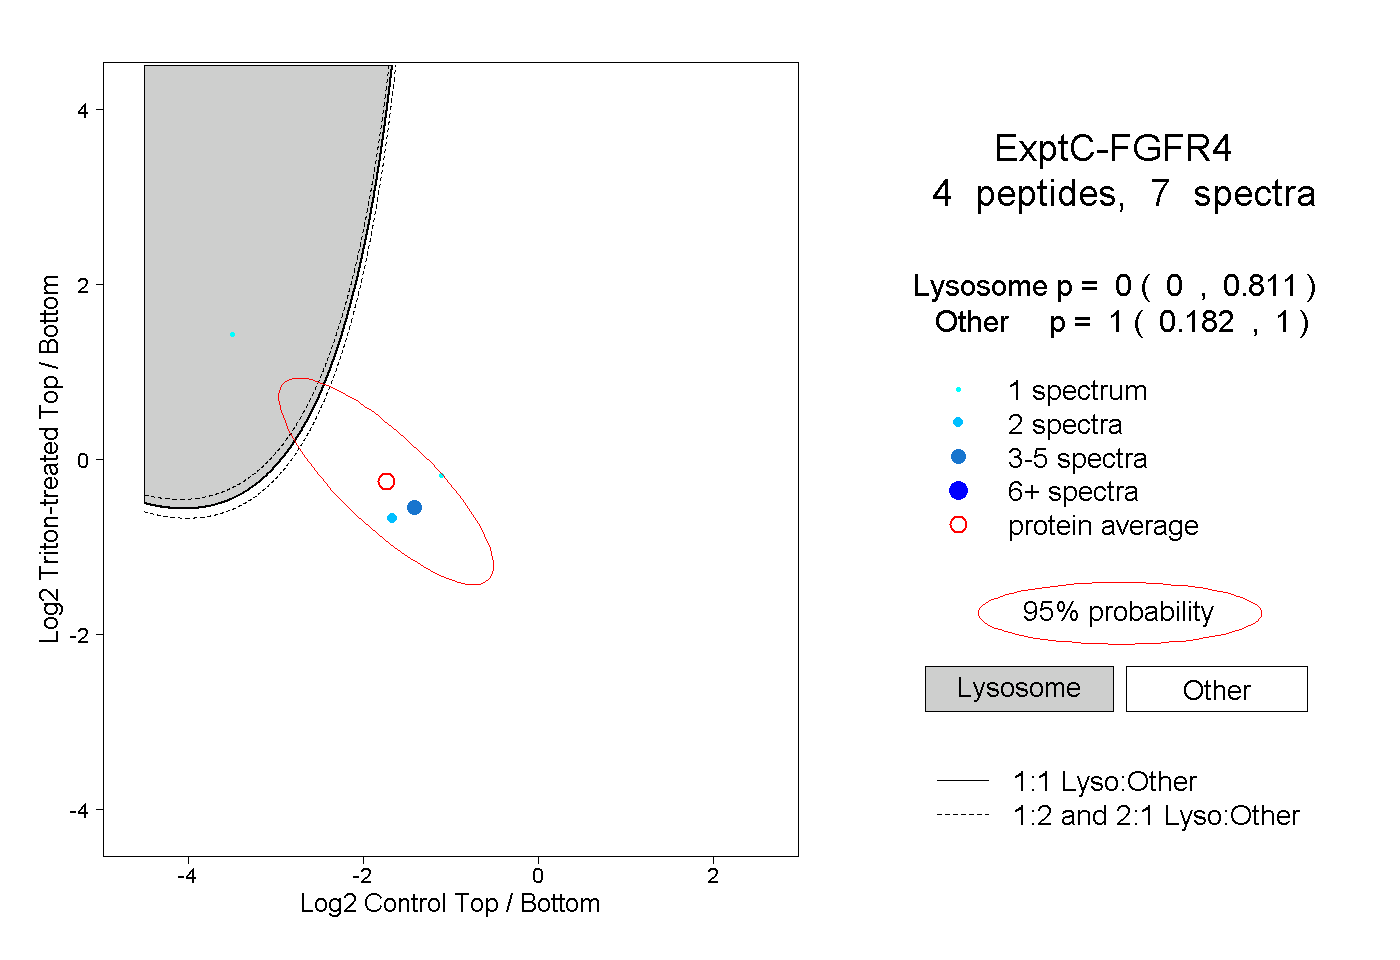
| Plot | Lyso | Other | |||||||||||
| Expt C |
4 peptides |
7 spectra |
|
0.000 0.000 | 0.811 |
1.000 0.182 | 1.000 |