6
6peptides
spectra
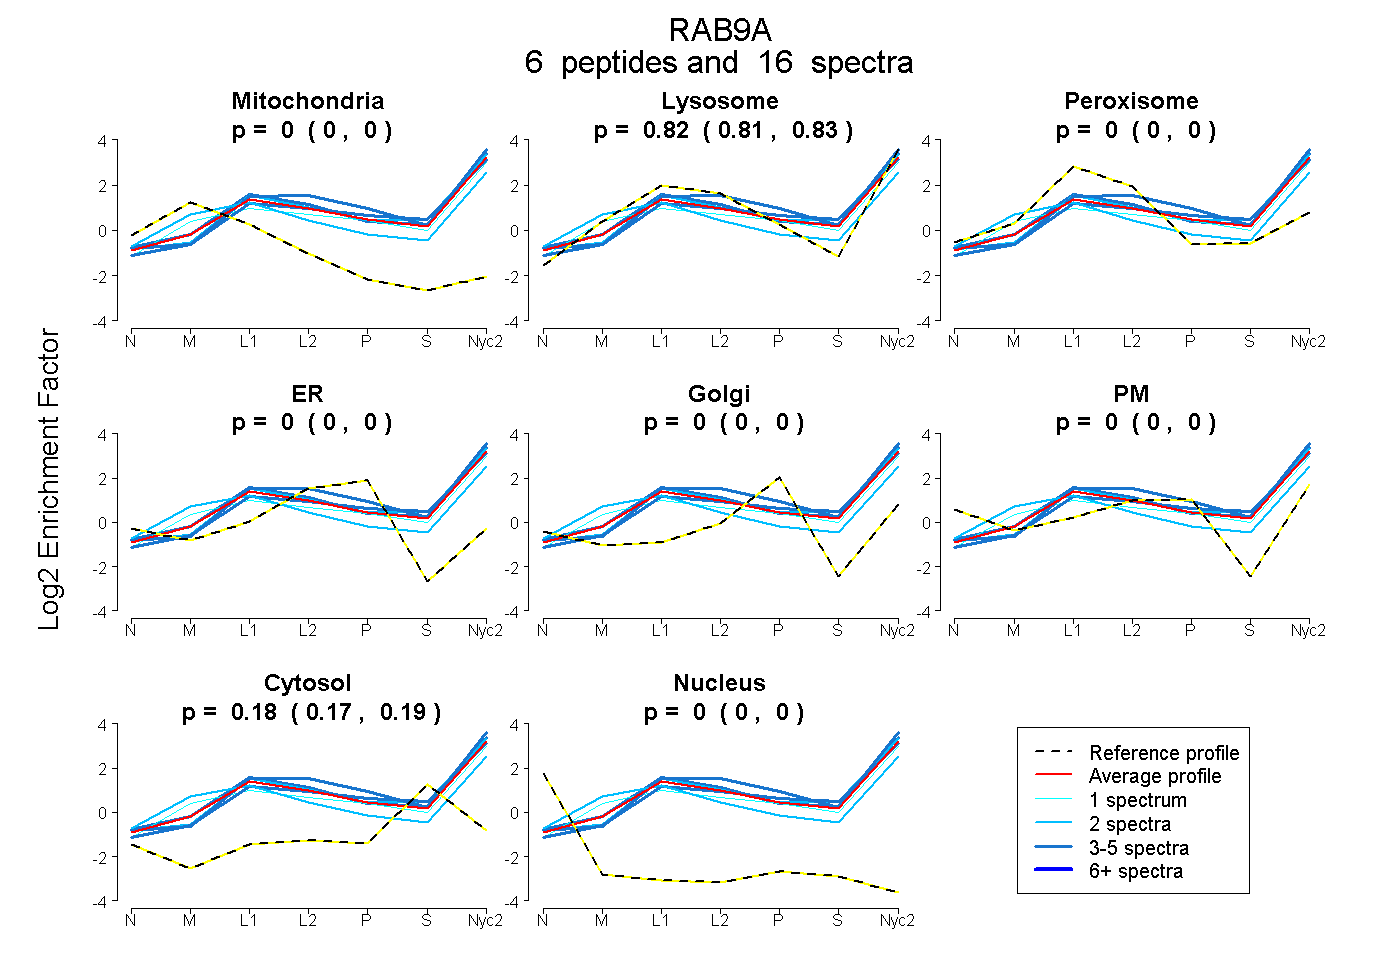
0.000 | 0.000
0.813 | 0.831
0.000 | 0.000
0.000 | 0.000
0.000 | 0.000
0.000 | 0.000
0.167 | 0.186
0.000 | 0.000
4peptides
spectra
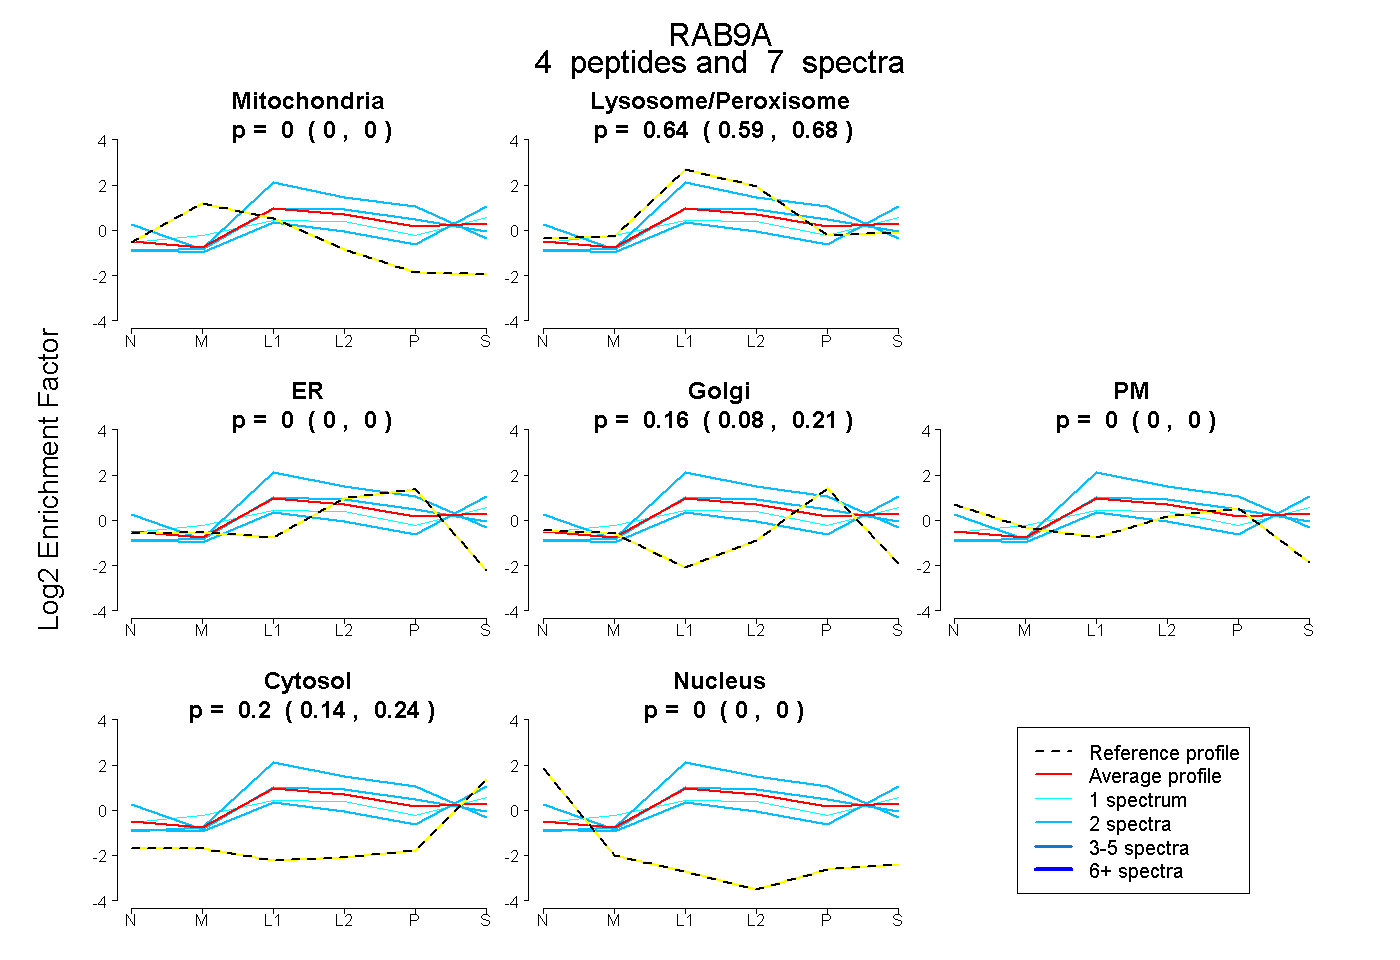
0.000 | 0.000
0.591 | 0.684
0.000 | 0.003
0.084 | 0.214
0.000 | 0.000
0.144 | 0.243
0.000 | 0.000