5
5peptides
spectra
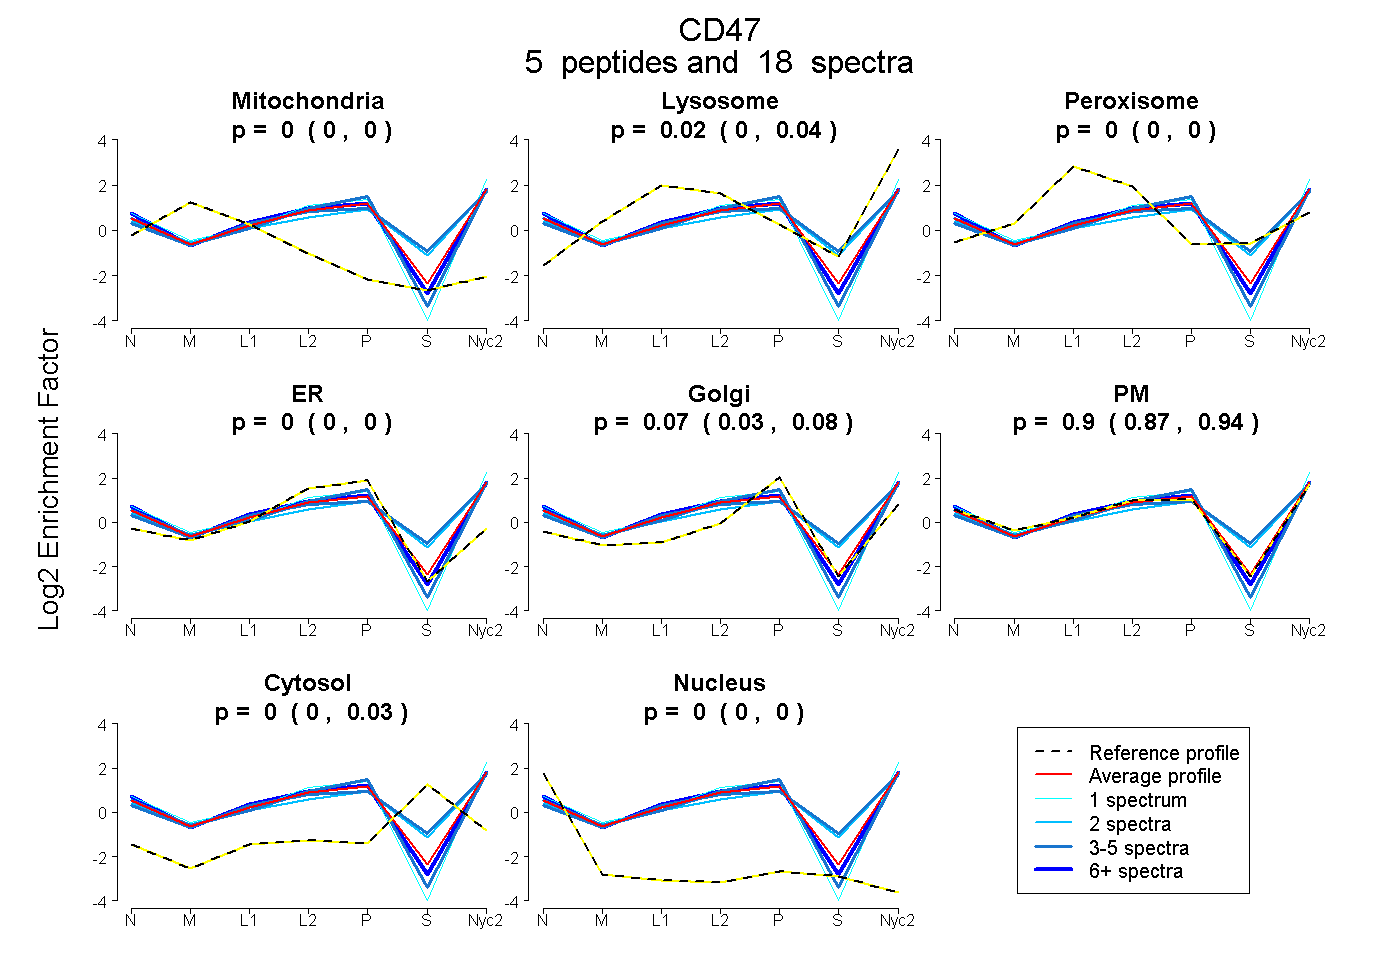
0.000 | 0.000
0.000 | 0.041
0.000 | 0.000
0.000 | 0.000
0.031 | 0.083
0.869 | 0.943
0.000 | 0.028
0.000 | 0.000
4peptides
spectra
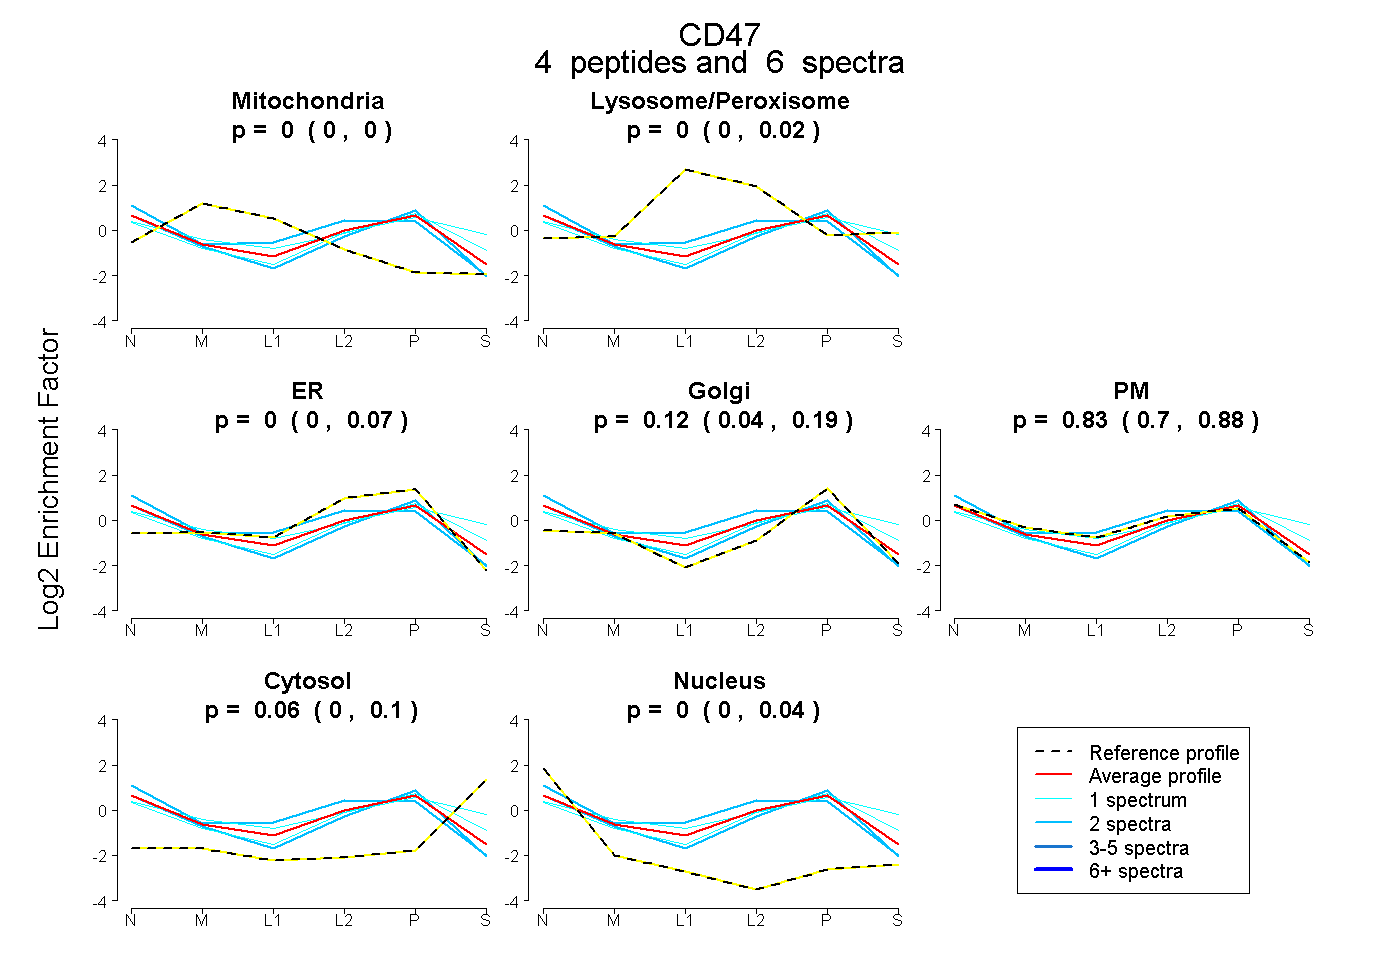
0.000 | 0.000
0.000 | 0.025
0.000 | 0.071
0.039 | 0.187
0.699 | 0.876
0.000 | 0.098
0.000 | 0.044