 18
18peptides
spectra
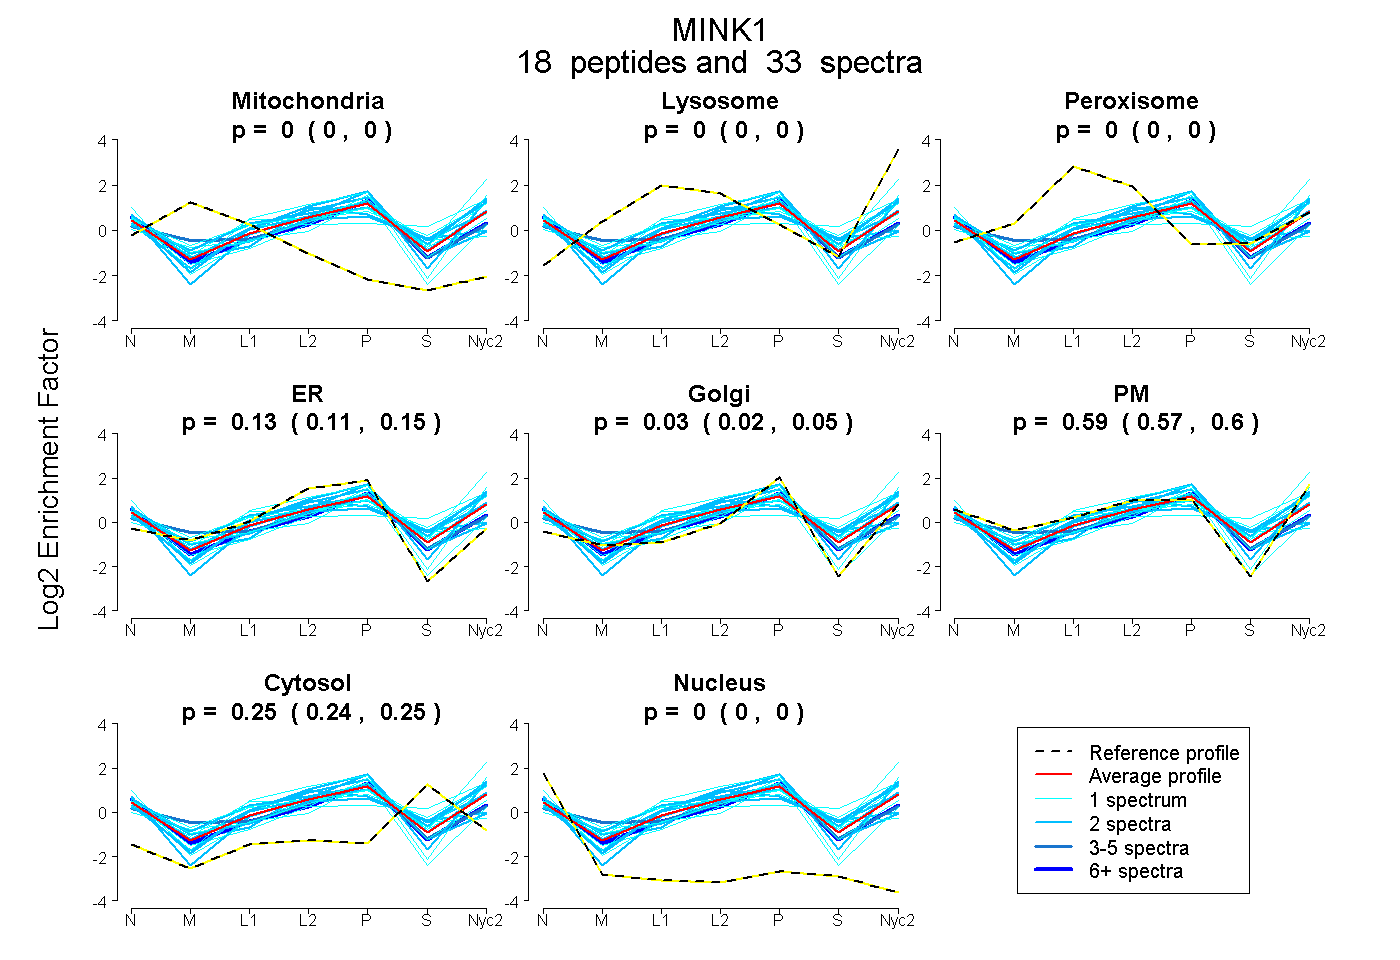
0.000 | 0.000
0.000 | 0.000
0.000 | 0.000
0.113 | 0.153
0.015 | 0.049
0.567 | 0.602
0.239 | 0.253
0.000 | 0.000
| Plot | Mito | Lyso | Perox | ER | Golgi | PM | Cytosol | Nucleus | |||||
| Expt A |
18 peptides |
33 spectra |
|
0.000 0.000 | 0.000 |
0.000 0.000 | 0.000 |
0.000 0.000 | 0.000 |
0.134 0.113 | 0.153 |
0.034 0.015 | 0.049 |
0.586 0.567 | 0.602 |
0.246 0.239 | 0.253 |
0.000 0.000 | 0.000 |
| 2 spectra, SQSLQDQPTR | 0.000 | 0.000 | 0.000 | 0.168 | 0.164 | 0.579 | 0.090 | 0.000 | ||
| 2 spectra, VFFASVR | 0.000 | 0.000 | 0.000 | 0.000 | 0.000 | 0.683 | 0.317 | 0.000 | ||
| 1 spectrum, VYGLIGR | 0.000 | 0.000 | 0.000 | 0.000 | 0.042 | 0.690 | 0.268 | 0.000 | ||
| 2 spectra, DPEAHIK | 0.000 | 0.000 | 0.000 | 0.551 | 0.106 | 0.130 | 0.214 | 0.000 | ||
| 2 spectra, AKPEDHR | 0.000 | 0.009 | 0.059 | 0.207 | 0.086 | 0.458 | 0.183 | 0.000 | ||
| 1 spectrum, TSSIATALNTSGAGGSRPAQAVR | 0.000 | 0.000 | 0.000 | 0.177 | 0.055 | 0.745 | 0.024 | 0.000 | ||
| 2 spectra, AHSETPEIR | 0.000 | 0.000 | 0.009 | 0.302 | 0.000 | 0.339 | 0.349 | 0.000 | ||
| 2 spectra, SNSAWQIYLQR | 0.000 | 0.102 | 0.106 | 0.000 | 0.142 | 0.477 | 0.173 | 0.000 | ||
| 1 spectrum, TGQLAAIK | 0.000 | 0.209 | 0.000 | 0.000 | 0.000 | 0.634 | 0.157 | 0.000 | ||
| 1 spectrum, FLVIALK | 0.000 | 0.028 | 0.000 | 0.000 | 0.000 | 0.540 | 0.432 | 0.000 | ||
| 1 spectrum, KPLYHYGR | 0.000 | 0.000 | 0.000 | 0.140 | 0.343 | 0.345 | 0.000 | 0.172 | ||
| 1 spectrum, SGGSSQVYFMTLNR | 0.000 | 0.041 | 0.150 | 0.000 | 0.000 | 0.545 | 0.263 | 0.000 | ||
| 2 spectra, GSVVNVNPTNTR | 0.000 | 0.000 | 0.000 | 0.102 | 0.000 | 0.546 | 0.352 | 0.000 | ||
| 4 spectra, HLLHQR | 0.023 | 0.000 | 0.049 | 0.204 | 0.256 | 0.288 | 0.179 | 0.000 | ||
| 1 spectrum, FTDFIDTCLIK | 0.000 | 0.000 | 0.063 | 0.473 | 0.065 | 0.093 | 0.304 | 0.000 | ||
| 6 spectra, ALFLIPR | 0.000 | 0.000 | 0.000 | 0.205 | 0.200 | 0.353 | 0.212 | 0.029 | ||
| 1 spectrum, QLQQEHAYLK | 0.000 | 0.000 | 0.194 | 0.060 | 0.496 | 0.152 | 0.098 | 0.000 | ||
| 1 spectrum, VEEQQR | 0.000 | 0.000 | 0.012 | 0.146 | 0.107 | 0.492 | 0.243 | 0.000 |
| Plot | Mito | Lyso or Perox | ER | Golgi | PM | Cytosol | Nucleus | ||||||
| Expt B |
1 peptide |
1 spectrum |
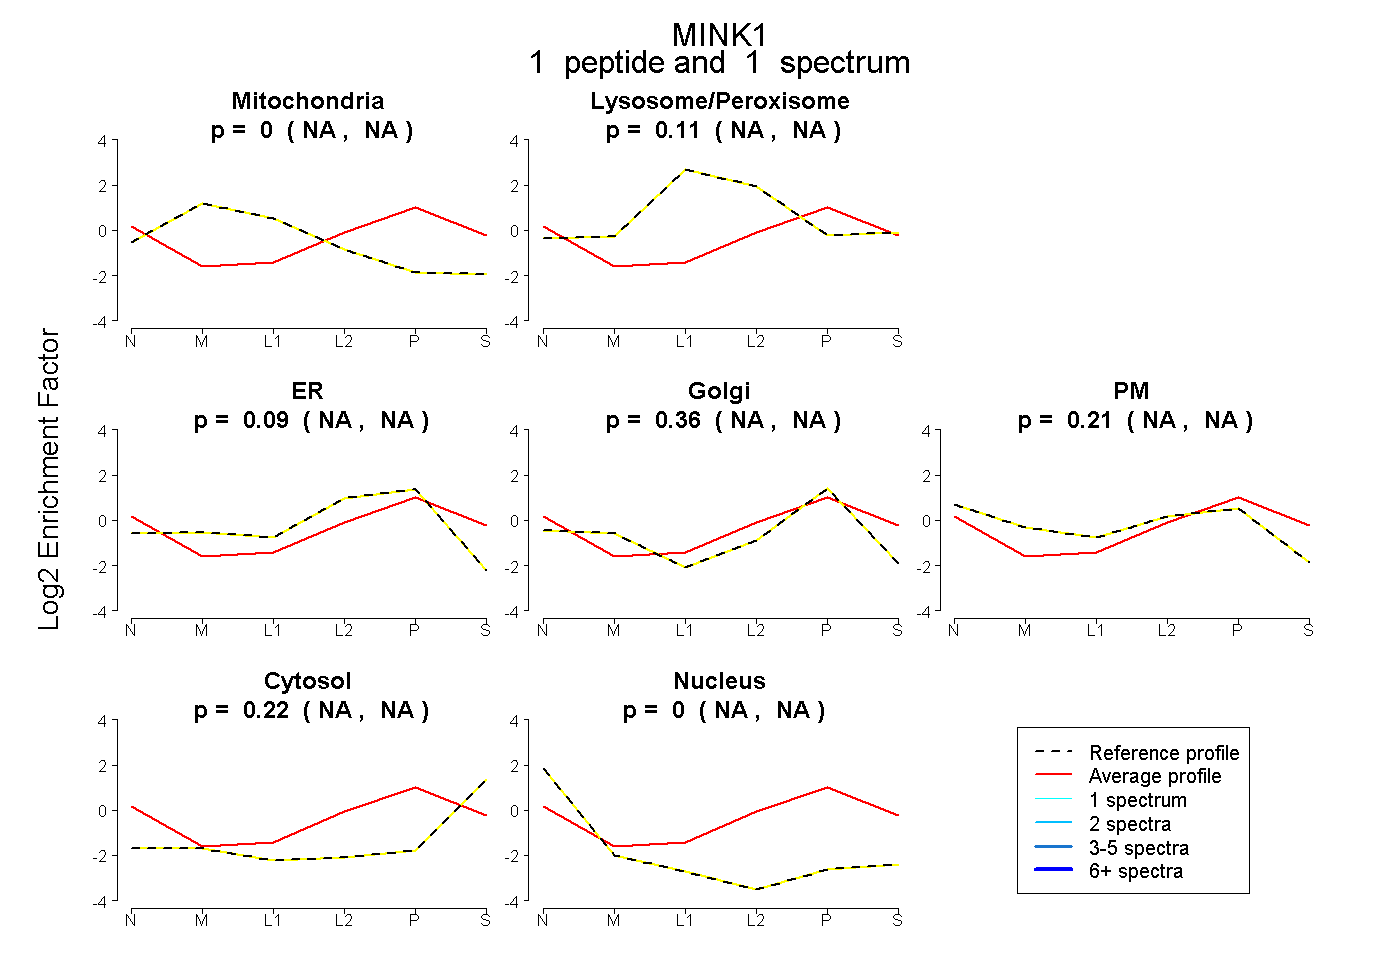 |
0.000 NA | NA |
0.111 NA | NA |
0.092 NA | NA |
0.358 NA | NA |
0.215 NA | NA |
0.224 NA | NA |
0.000 NA | NA |
|||
| Plot | Lyso | Other | |||||||||||
| Expt C |
13 peptides |
24 spectra |
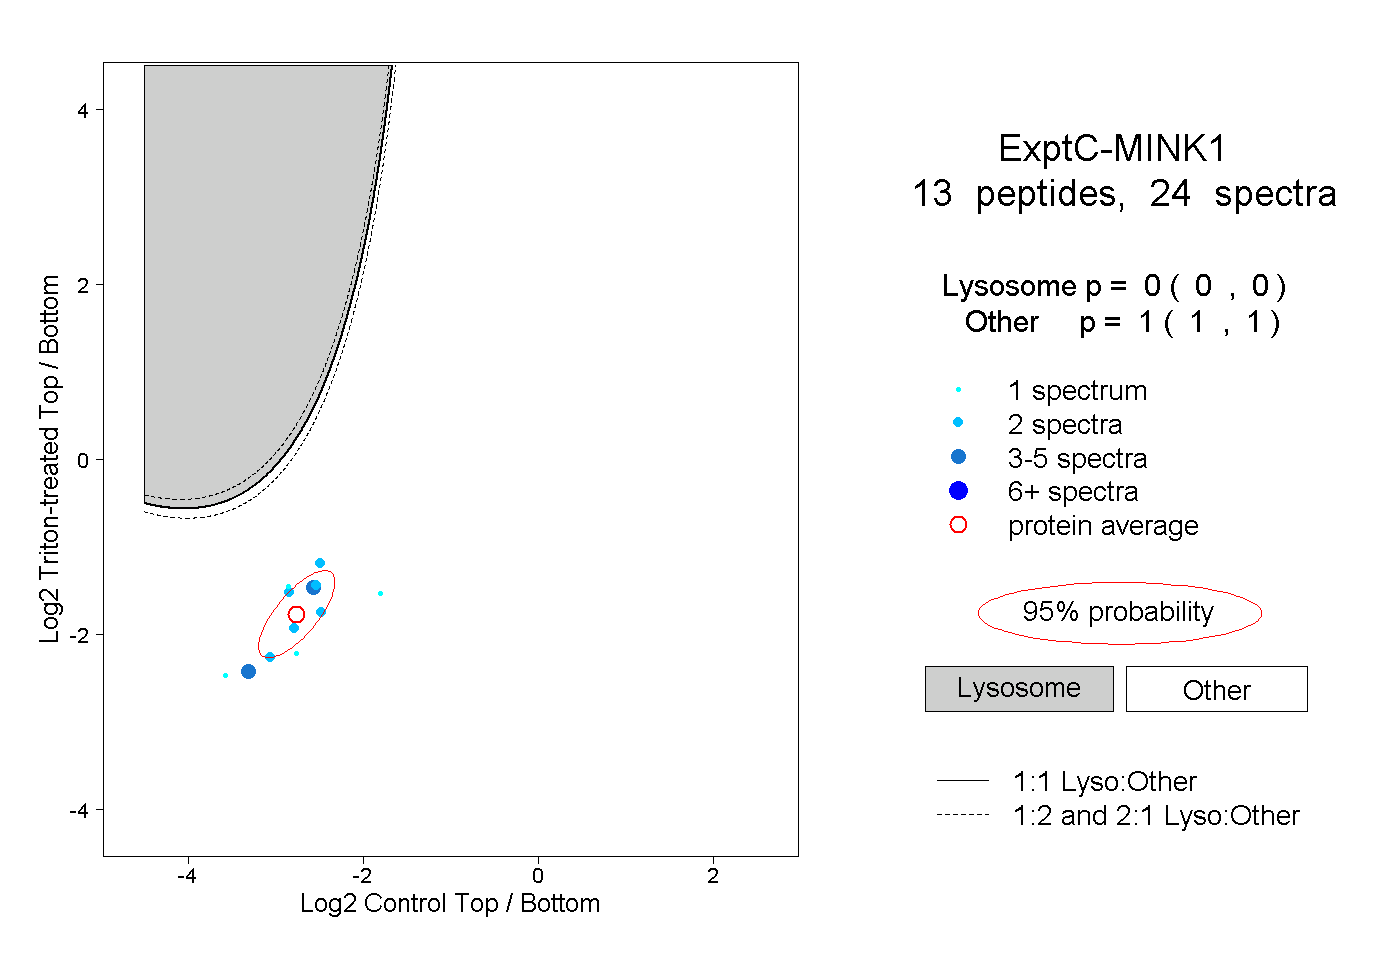 |
0.000 0.000 | 0.000 |
1.000 1.000 | 1.000 |