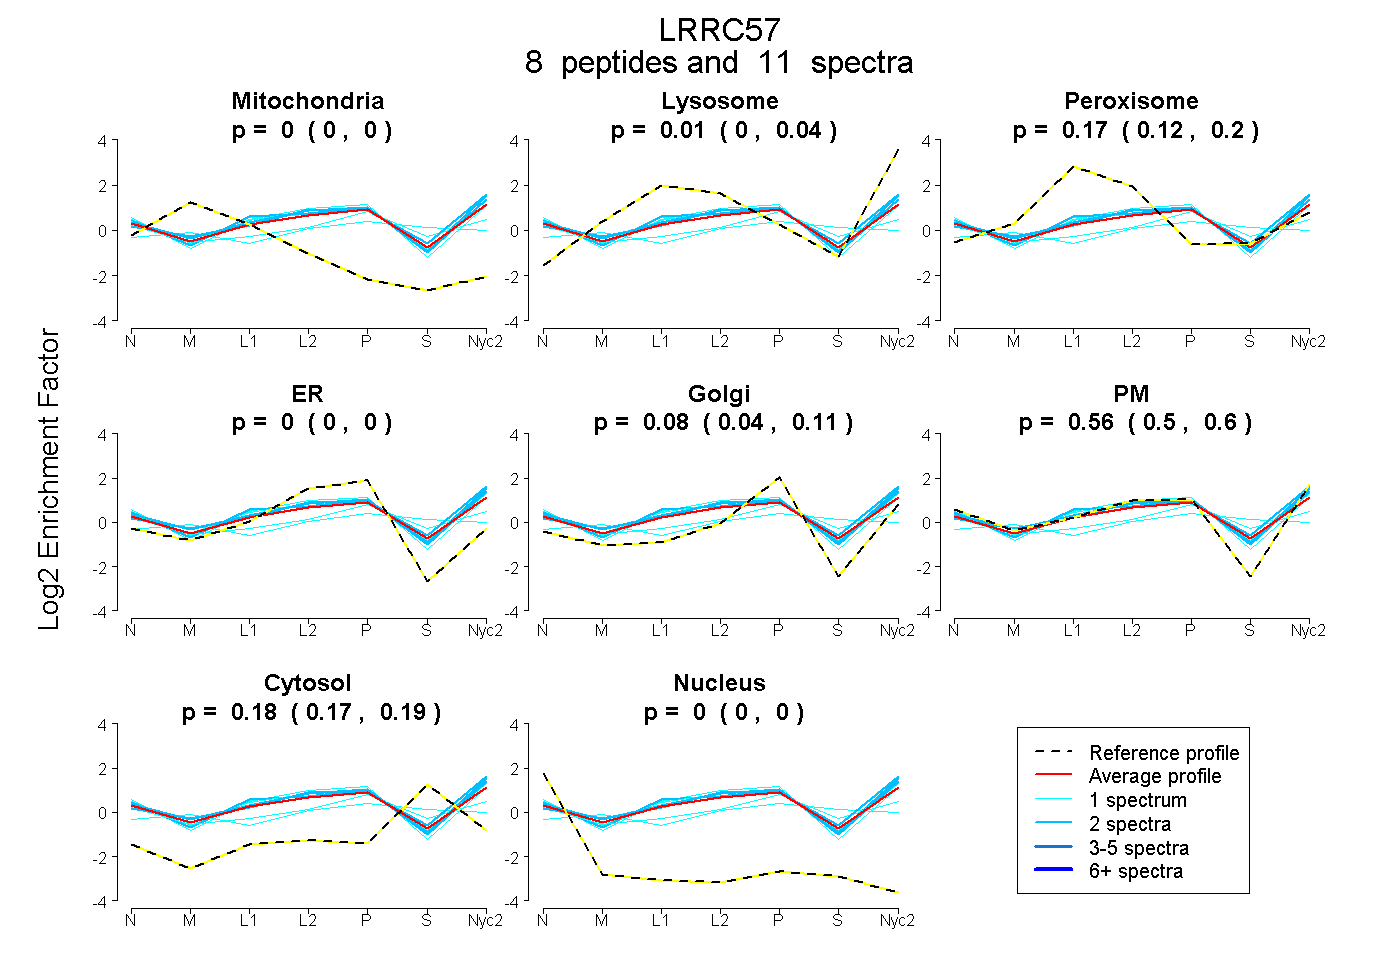
 8
8peptides
spectra
0.000 | 0.000
0.000 | 0.042
0.123 | 0.198
0.000 | 0.000
0.036 | 0.114
0.504 | 0.602
0.167 | 0.194
0.000 | 0.000
| Plot | Mito | Lyso | Perox | ER | Golgi | PM | Cytosol | Nucleus | |||||
| Expt A |
8 peptides |
11 spectra |
|
0.000 0.000 | 0.000 |
0.011 0.000 | 0.042 |
0.170 0.123 | 0.198 |
0.000 0.000 | 0.000 |
0.077 0.036 | 0.114 |
0.561 0.504 | 0.602 |
0.181 0.167 | 0.194 |
0.000 0.000 | 0.000 |
| 1 spectrum, AHVETAQK | 0.000 | 0.000 | 0.133 | 0.099 | 0.000 | 0.651 | 0.117 | 0.000 | ||
| 1 spectrum, SLSLNNNK | 0.000 | 0.047 | 0.161 | 0.000 | 0.028 | 0.623 | 0.141 | 0.000 | ||
| 1 spectrum, GLTEFPSELQK | 0.000 | 0.002 | 0.174 | 0.000 | 0.030 | 0.658 | 0.135 | 0.000 | ||
| 1 spectrum, LTVLPDELCNLK | 0.000 | 0.000 | 0.136 | 0.000 | 0.180 | 0.377 | 0.307 | 0.000 | ||
| 2 spectra, HLDVVDLSK | 0.000 | 0.068 | 0.123 | 0.000 | 0.000 | 0.666 | 0.143 | 0.000 | ||
| 2 spectra, TIDLSNNK | 0.000 | 0.048 | 0.139 | 0.000 | 0.047 | 0.642 | 0.124 | 0.000 | ||
| 1 spectrum, LETLSLNNNHLR | 0.052 | 0.000 | 0.230 | 0.000 | 0.300 | 0.067 | 0.350 | 0.000 | ||
| 2 spectra, TGVFQLK | 0.000 | 0.176 | 0.072 | 0.000 | 0.000 | 0.573 | 0.179 | 0.000 |
| Plot | Lyso | Other | |||||||||||
| Expt C |
5 peptides |
14 spectra |
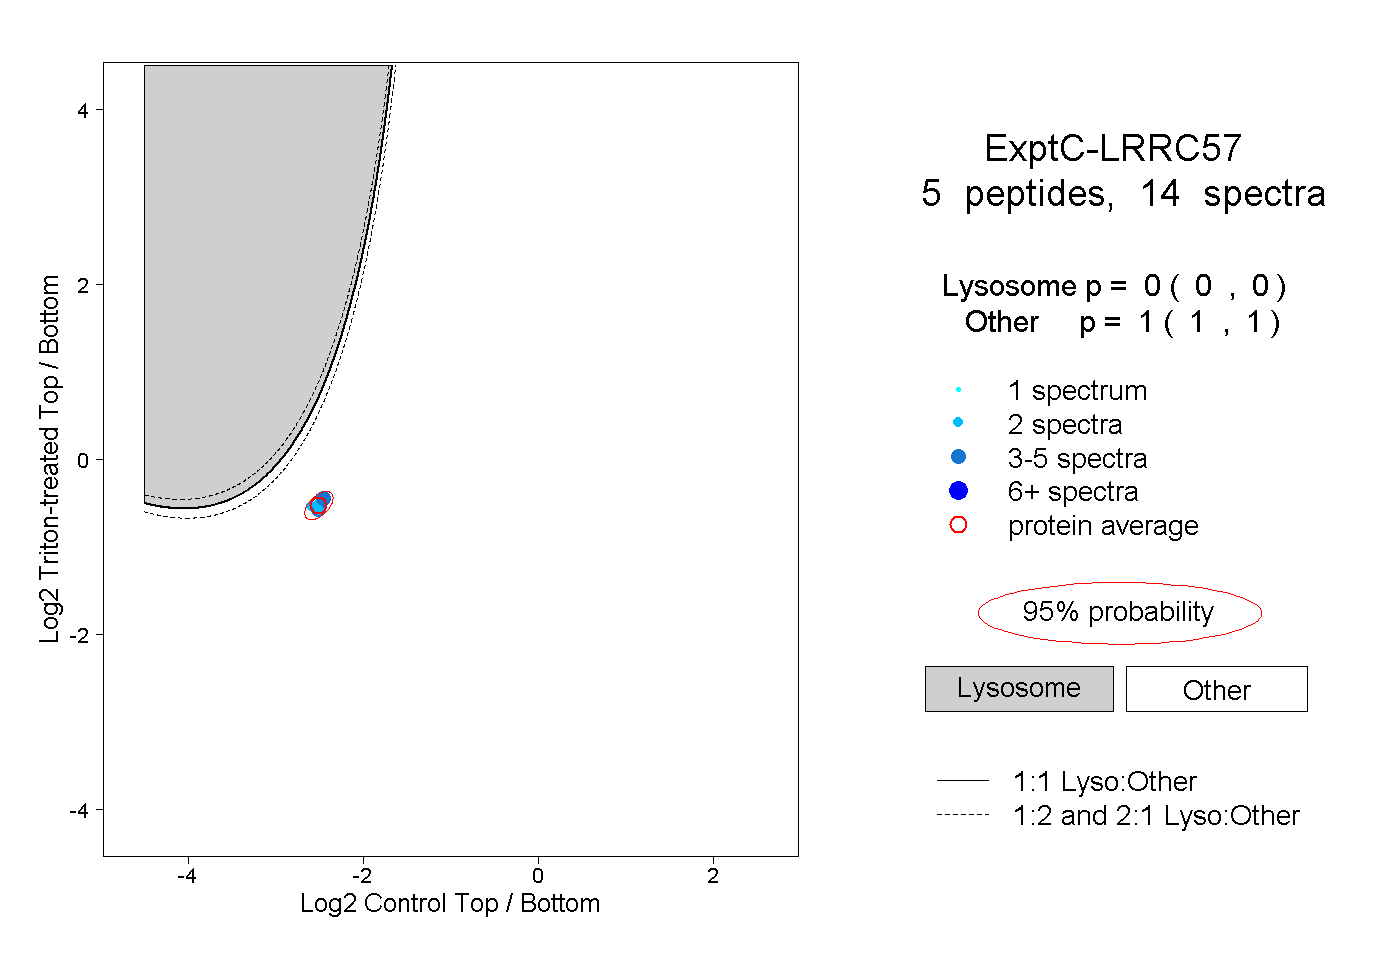 |
0.000 0.000 | 0.000 |
1.000 1.000 | 1.000 |