 3
3peptides
spectra
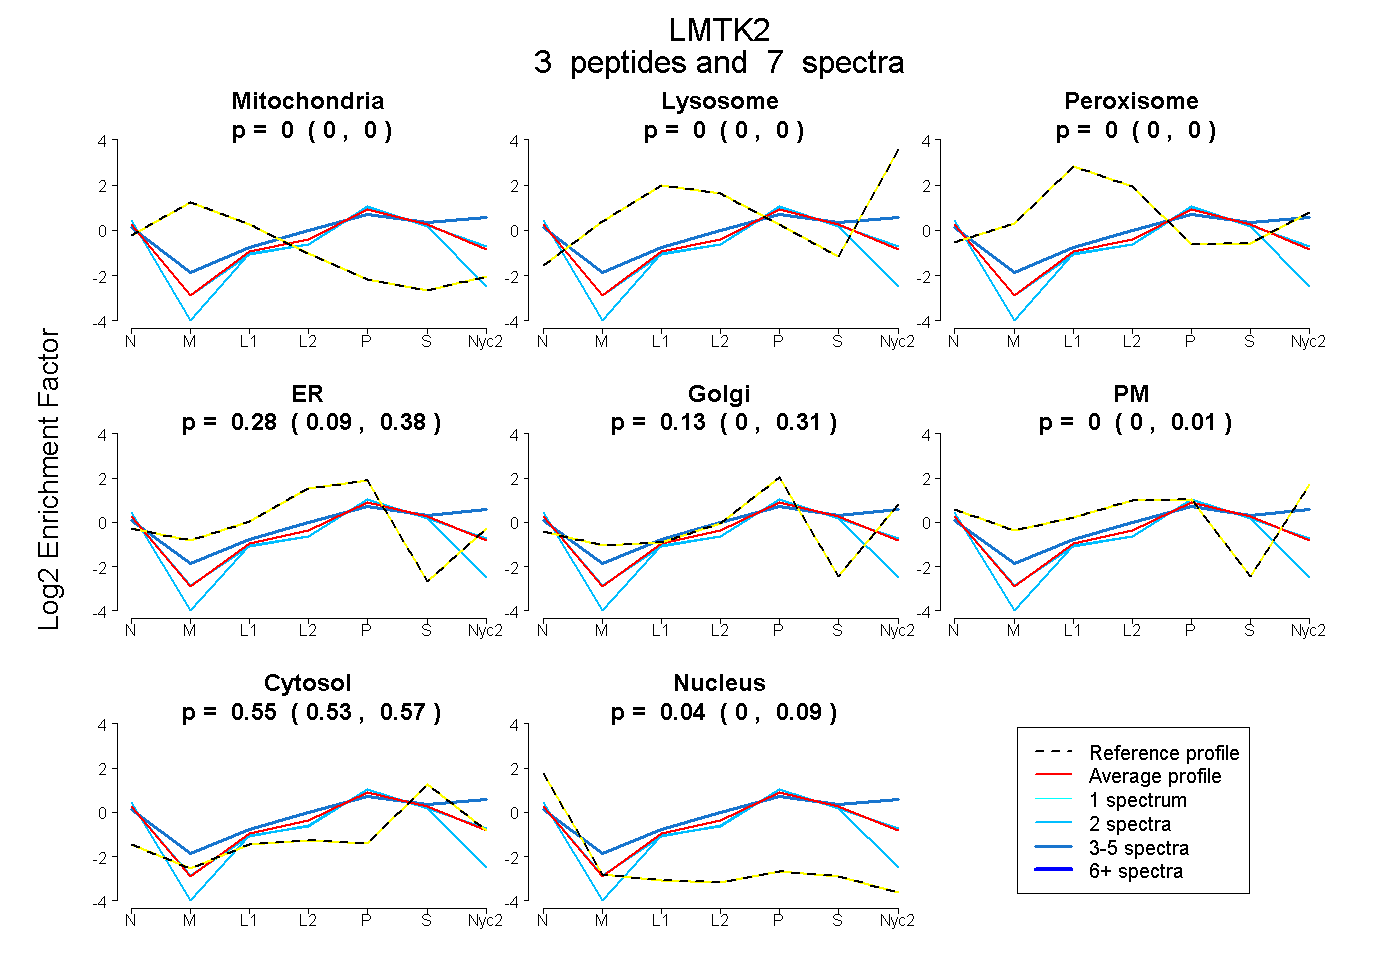
0.000 | 0.000
0.000 | 0.000
0.000 | 0.000
0.089 | 0.381
0.000 | 0.308
0.000 | 0.011
0.529 | 0.567
0.000 | 0.086
| Plot | Mito | Lyso | Perox | ER | Golgi | PM | Cytosol | Nucleus | |||||
| Expt A |
3 peptides |
7 spectra |
|
0.000 0.000 | 0.000 |
0.000 0.000 | 0.000 |
0.000 0.000 | 0.000 |
0.277 0.089 | 0.381 |
0.129 0.000 | 0.308 |
0.000 0.000 | 0.011 |
0.550 0.529 | 0.567 |
0.043 0.000 | 0.086 |
| 2 spectra, ETYPVDDEAR | 0.000 | 0.000 | 0.000 | 0.137 | 0.290 | 0.000 | 0.523 | 0.049 | ||
| 2 spectra, APDGGDGPPEVTCQSK | 0.000 | 0.000 | 0.000 | 0.295 | 0.000 | 0.000 | 0.504 | 0.201 | ||
| 3 spectra, HDHFDEQGR | 0.000 | 0.000 | 0.000 | 0.000 | 0.101 | 0.399 | 0.500 | 0.000 |
| Plot | Lyso | Other | |||||||||||
| Expt C |
2 peptides |
3 spectra |
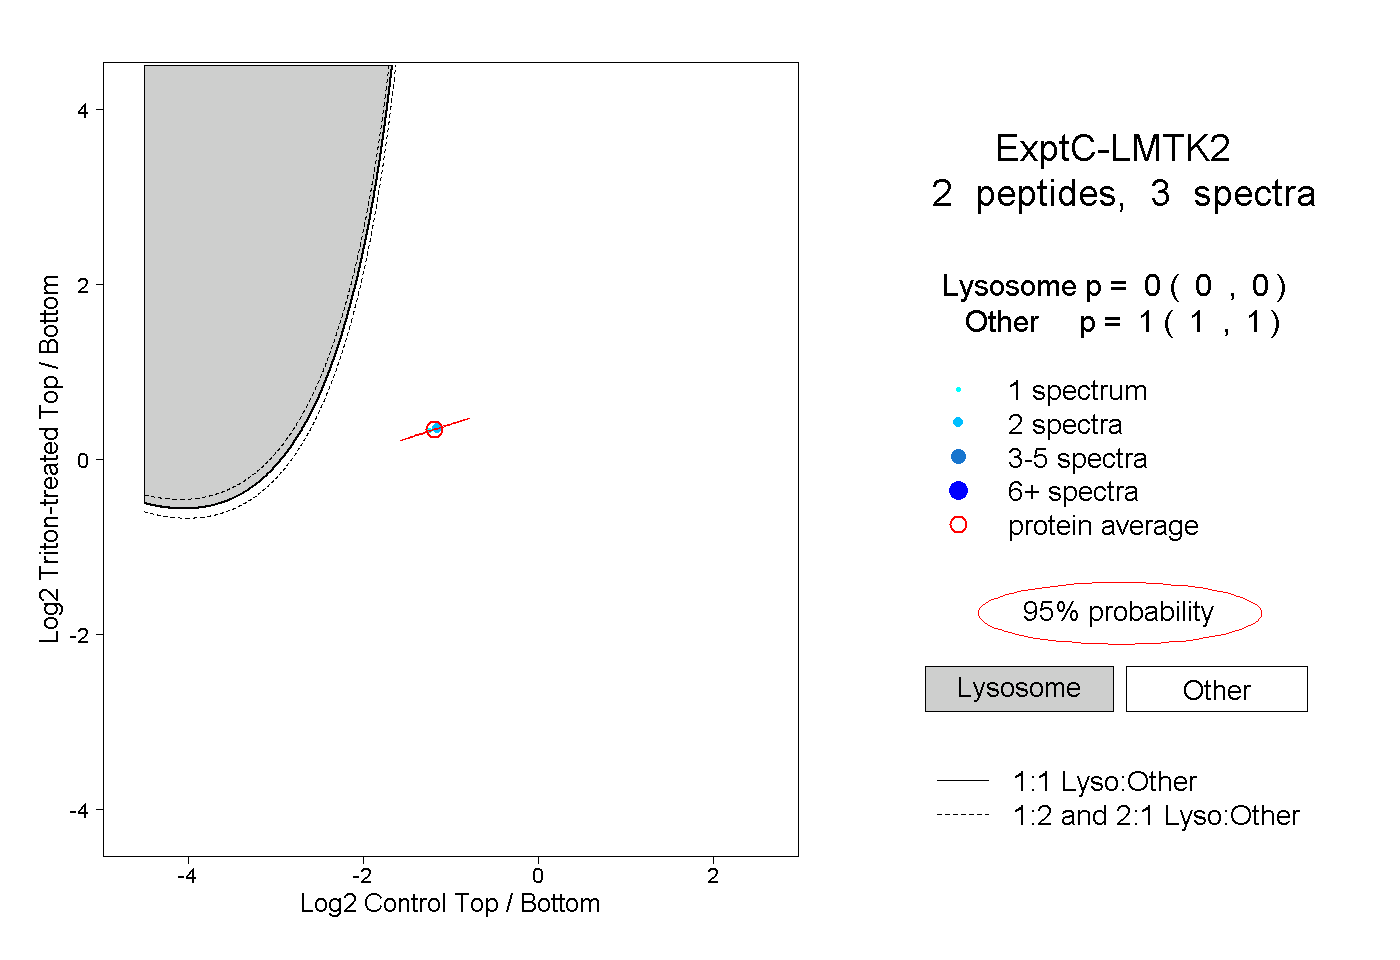 |
0.000 0.000 | 0.000 |
1.000 1.000 | 1.000 |