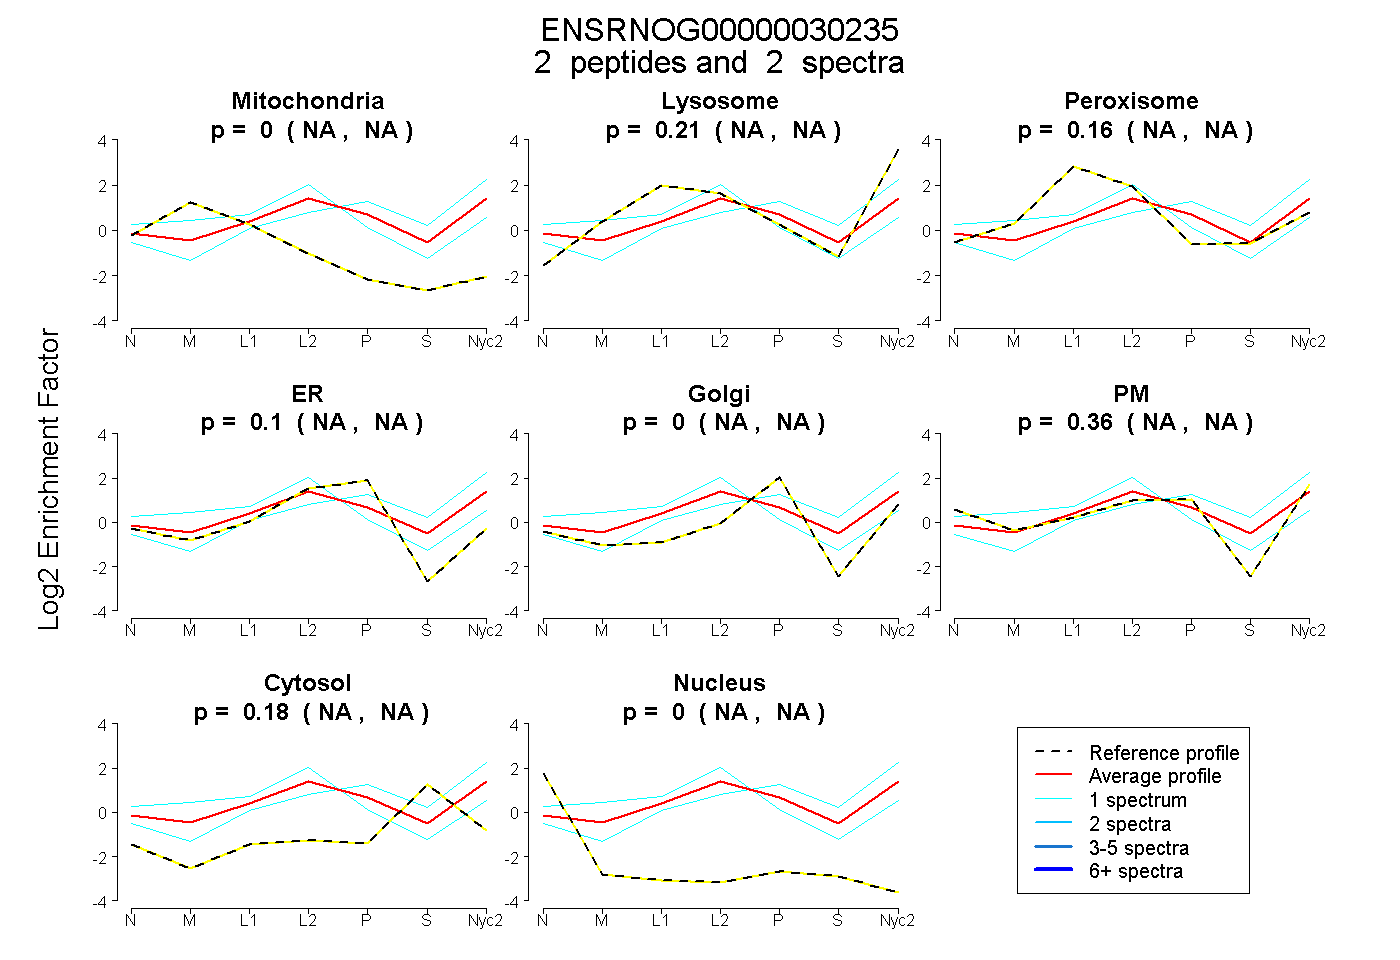
 2
2peptides
spectra
NA | NA
NA | NA
NA | NA
NA | NA
NA | NA
NA | NA
NA | NA
NA | NA
| Plot | Mito | Lyso | Perox | ER | Golgi | PM | Cytosol | Nucleus | |||||
| Expt A |
2 peptides |
2 spectra |
|
0.000 NA | NA |
0.205 NA | NA |
0.160 NA | NA |
0.096 NA | NA |
0.000 NA | NA |
0.363 NA | NA |
0.176 NA | NA |
0.000 NA | NA |
| 1 spectrum, STNTAYMELSR | 0.000 | 0.448 | 0.000 | 0.000 | 0.271 | 0.029 | 0.252 | 0.000 | ||
| 1 spectrum, LTSEDSATYYCTR | 0.067 | 0.000 | 0.446 | 0.181 | 0.000 | 0.306 | 0.000 | 0.000 |
| Plot | Lyso | Other | |||||||||||
| Expt C |
3 peptides |
4 spectra |
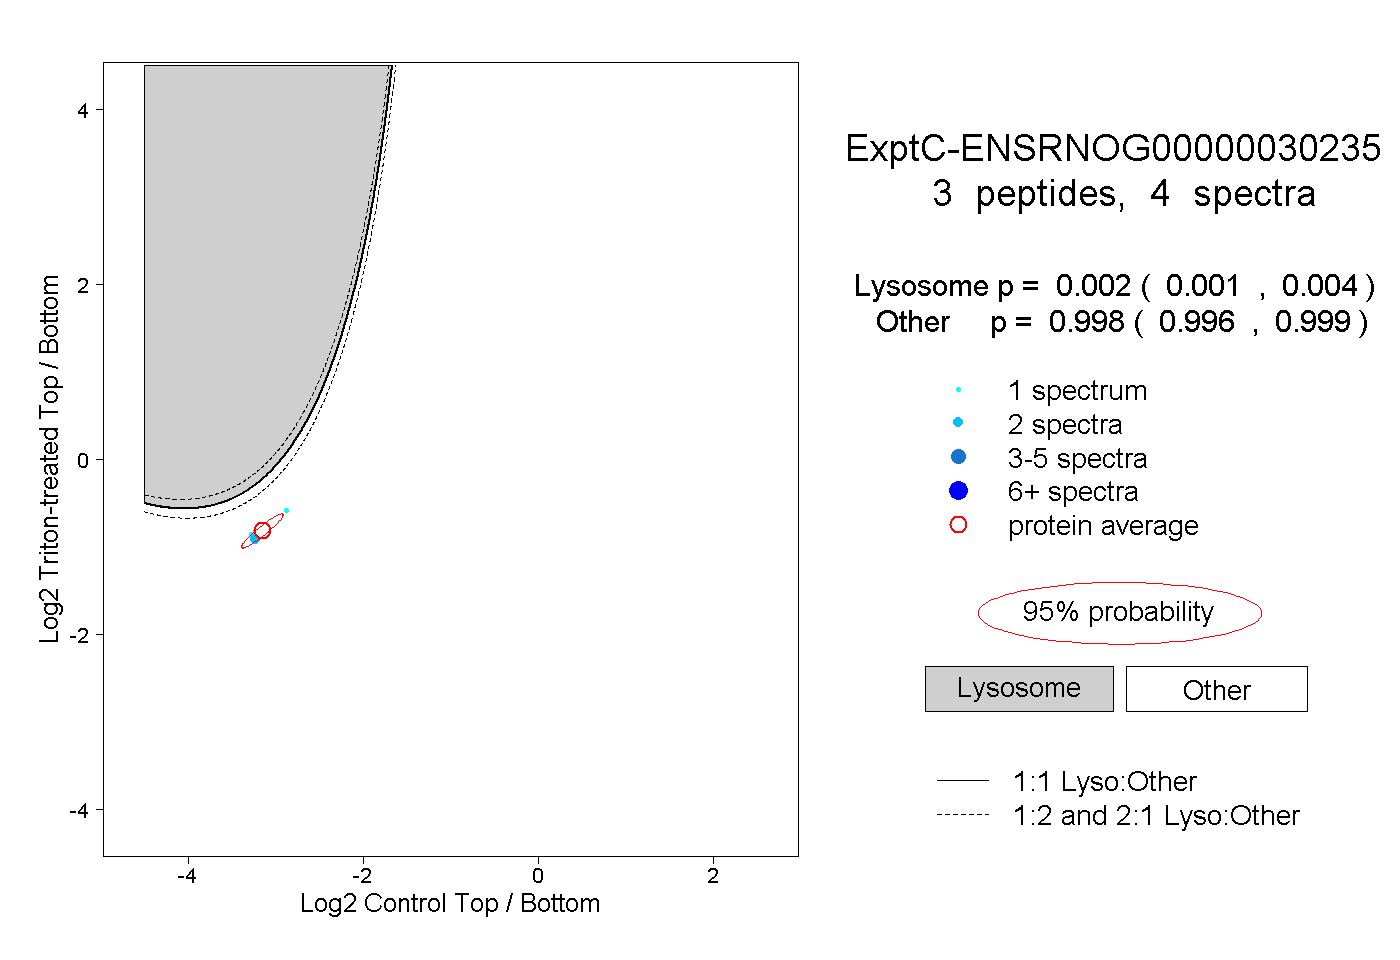 |
0.002 0.001 | 0.004 |
0.998 0.996 | 0.999 |