 6
6peptides
spectra
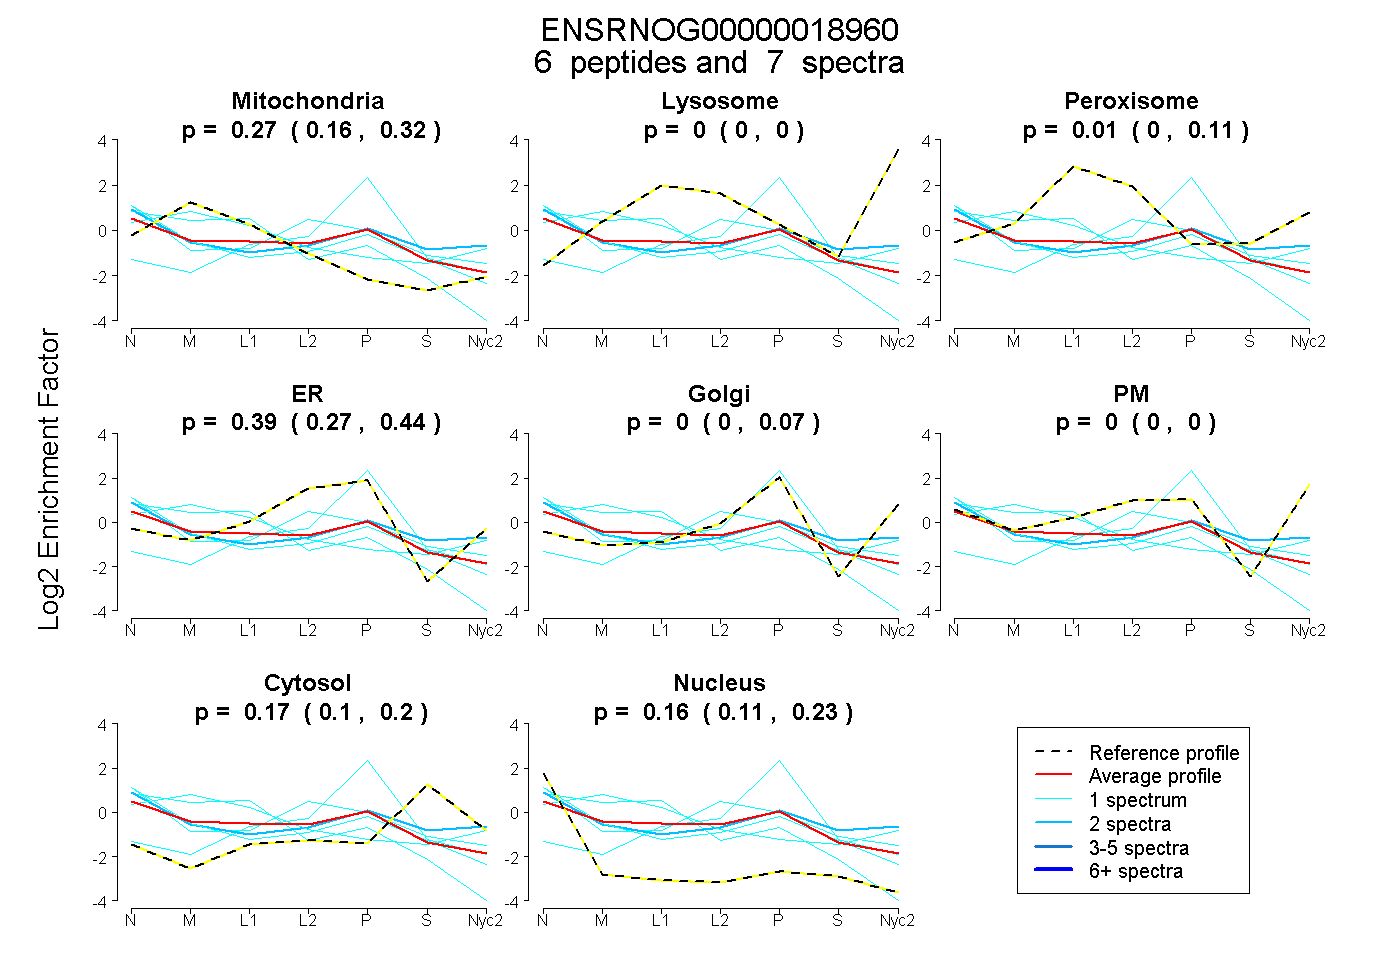
0.163 | 0.324
0.000 | 0.000
0.000 | 0.110
0.270 | 0.437
0.000 | 0.066
0.000 | 0.000
0.101 | 0.201
0.106 | 0.231
| Plot | Mito | Lyso | Perox | ER | Golgi | PM | Cytosol | Nucleus | |||||
| Expt A |
6 peptides |
7 spectra |
|
0.269 0.163 | 0.324 |
0.000 0.000 | 0.000 |
0.014 0.000 | 0.110 |
0.389 0.270 | 0.437 |
0.000 0.000 | 0.066 |
0.000 0.000 | 0.000 |
0.166 0.101 | 0.201 |
0.162 0.106 | 0.231 |
| 1 spectrum, DYQEEIAVAQENK | 0.679 | 0.000 | 0.000 | 0.125 | 0.000 | 0.000 | 0.000 | 0.196 | ||
| 1 spectrum, FEDWLEISER | 0.221 | 0.000 | 0.000 | 0.336 | 0.000 | 0.000 | 0.133 | 0.310 | ||
| 1 spectrum, ESHDLQDR | 0.000 | 0.000 | 0.209 | 0.408 | 0.000 | 0.000 | 0.092 | 0.291 | ||
| 1 spectrum, LSESLQPGR | 0.601 | 0.000 | 0.073 | 0.000 | 0.000 | 0.203 | 0.123 | 0.000 | ||
| 2 spectra, FEAFQR | 0.108 | 0.000 | 0.000 | 0.015 | 0.050 | 0.407 | 0.254 | 0.166 | ||
| 1 spectrum, DVIEDTLGCLLGR | 0.000 | 0.000 | 0.000 | 0.564 | 0.095 | 0.000 | 0.302 | 0.039 |
| Plot | Lyso | Other | |||||||||||
| Expt C |
4 peptides |
5 spectra |
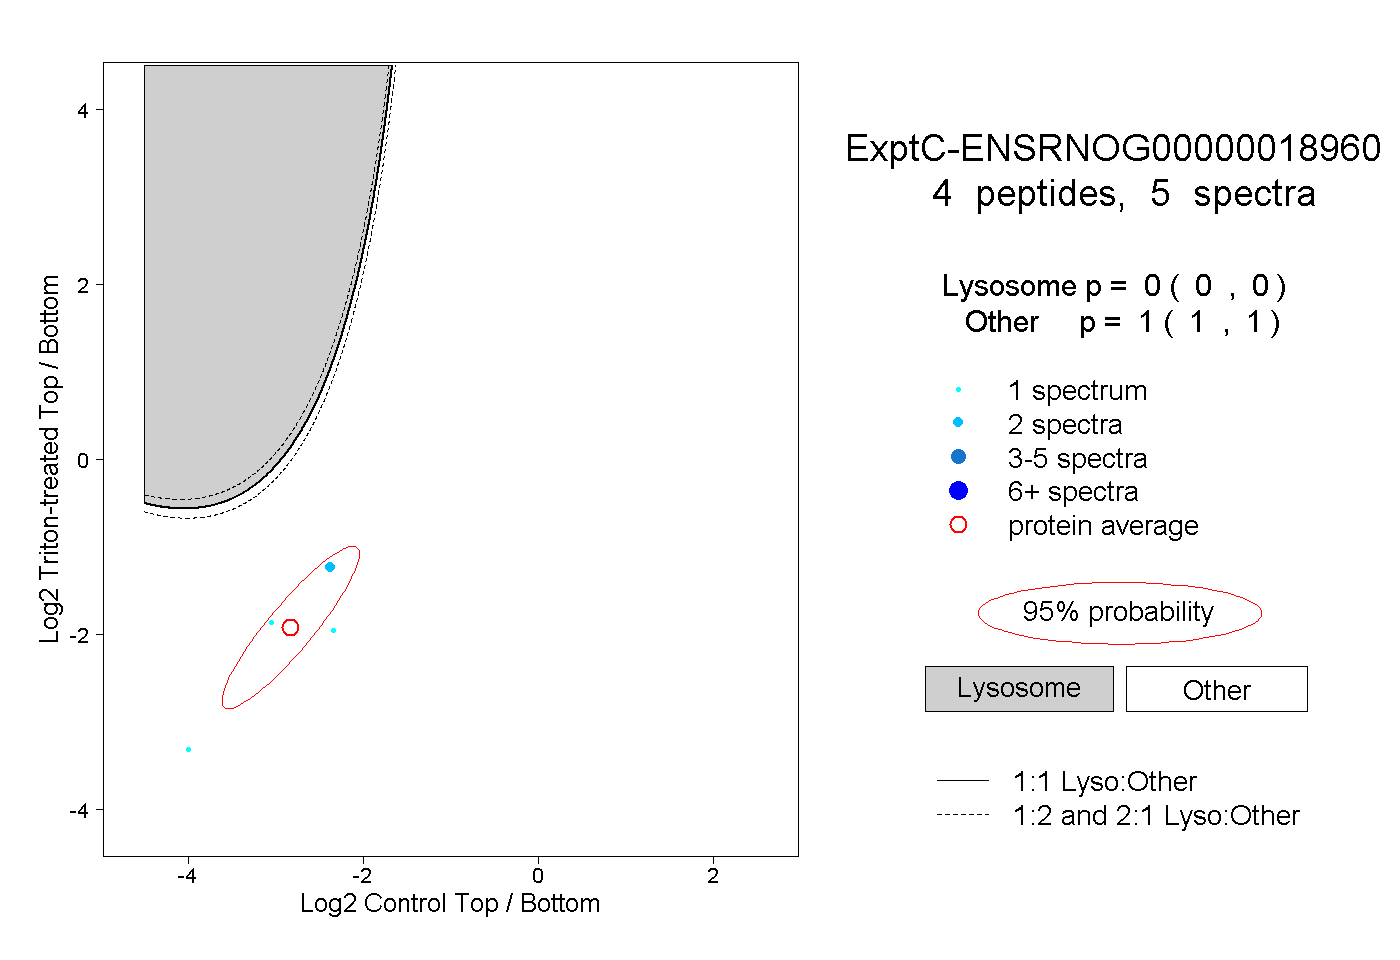 |
0.000 0.000 | 0.000 |
1.000 1.000 | 1.000 |