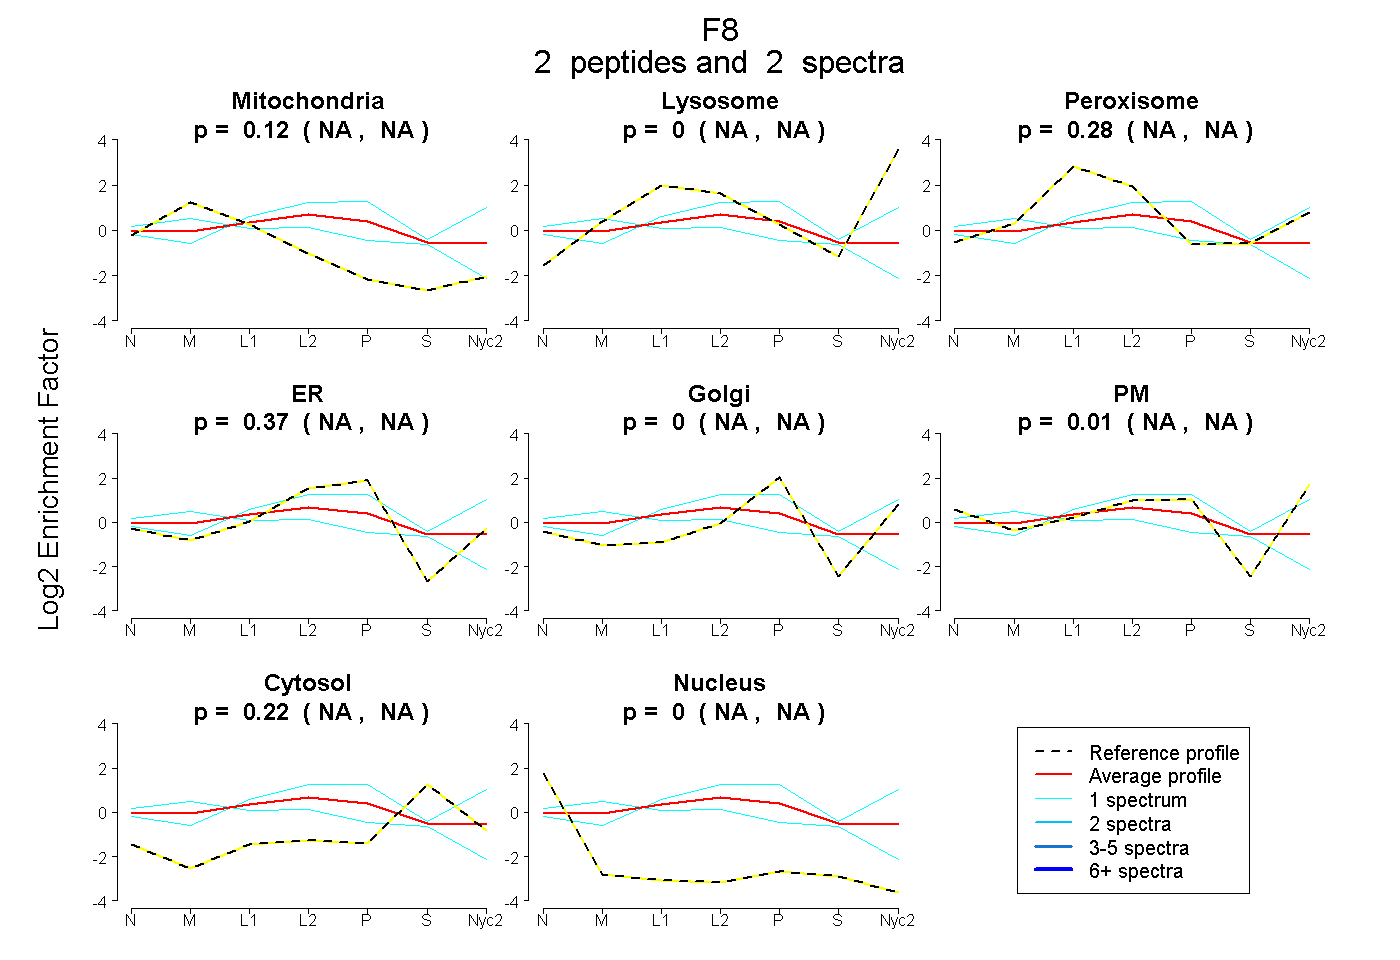
 2
2peptides
spectra
NA | NA
NA | NA
NA | NA
NA | NA
NA | NA
NA | NA
NA | NA
NA | NA
| Plot | Mito | Lyso | Perox | ER | Golgi | PM | Cytosol | Nucleus | |||||
| Expt A |
2 peptides |
2 spectra |
|
0.118 NA | NA |
0.000 NA | NA |
0.282 NA | NA |
0.371 NA | NA |
0.000 NA | NA |
0.006 NA | NA |
0.223 NA | NA |
0.000 NA | NA |
| 1 spectrum, GNTLLSDVDEK | 0.000 | 0.157 | 0.235 | 0.203 | 0.157 | 0.114 | 0.134 | 0.000 | ||
| 1 spectrum, HWTHVLQDGK | 0.471 | 0.000 | 0.111 | 0.210 | 0.000 | 0.000 | 0.208 | 0.000 |
| Plot | Lyso | Other | |||||||||||
| Expt C |
1 peptide |
2 spectra |
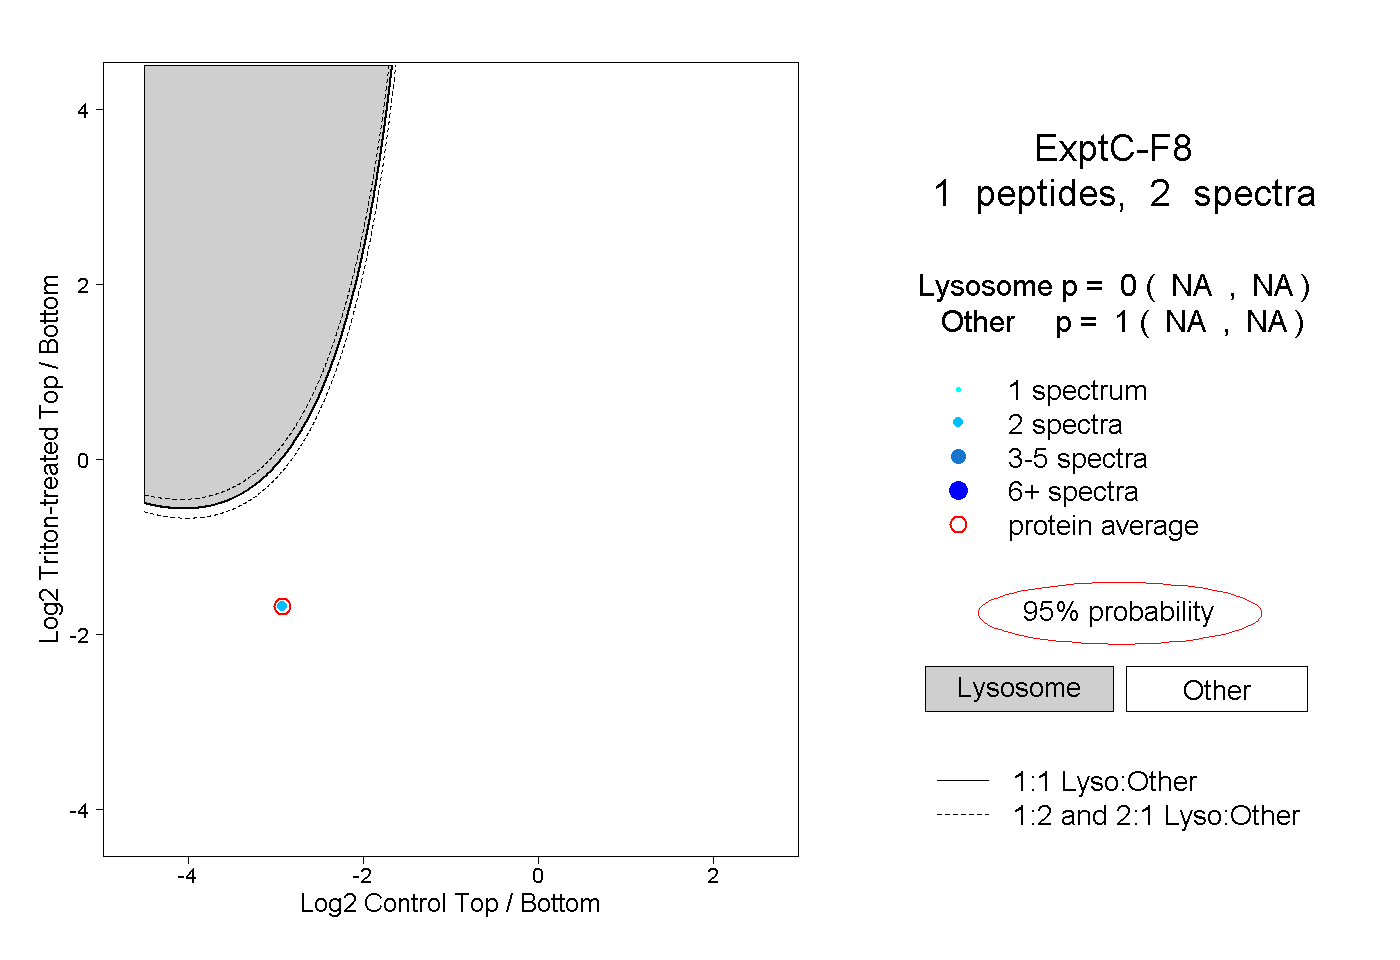 |
0.000 NA | NA |
1.000 NA | NA |