11
11peptides
spectra
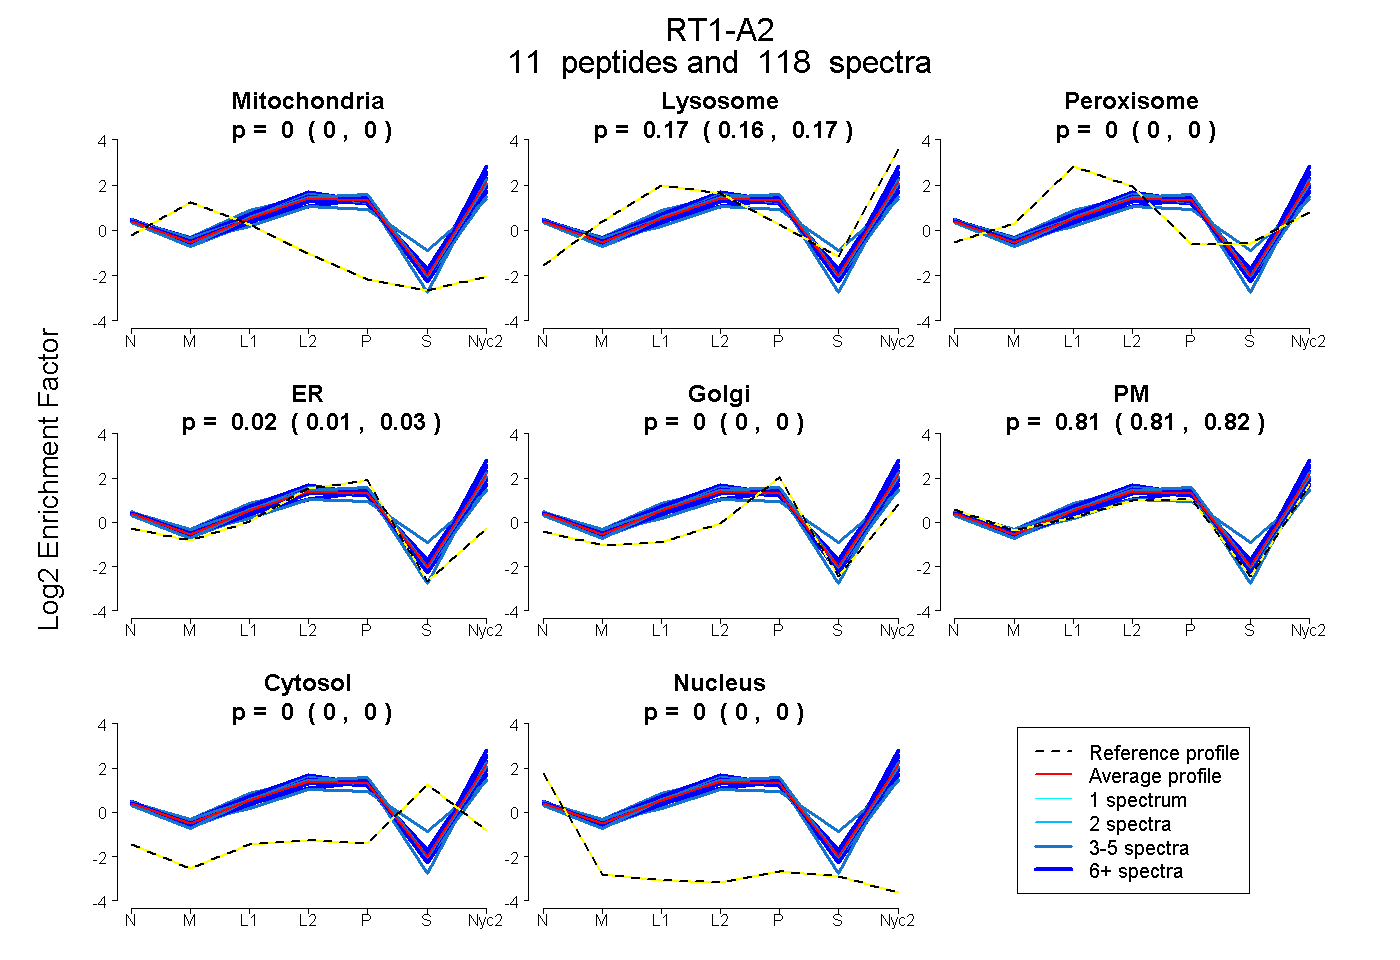
0.000 | 0.000
0.163 | 0.168
0.000 | 0.000
0.013 | 0.027
0.000 | 0.000
0.807 | 0.819
0.000 | 0.000
0.000 | 0.000
9peptides
spectra
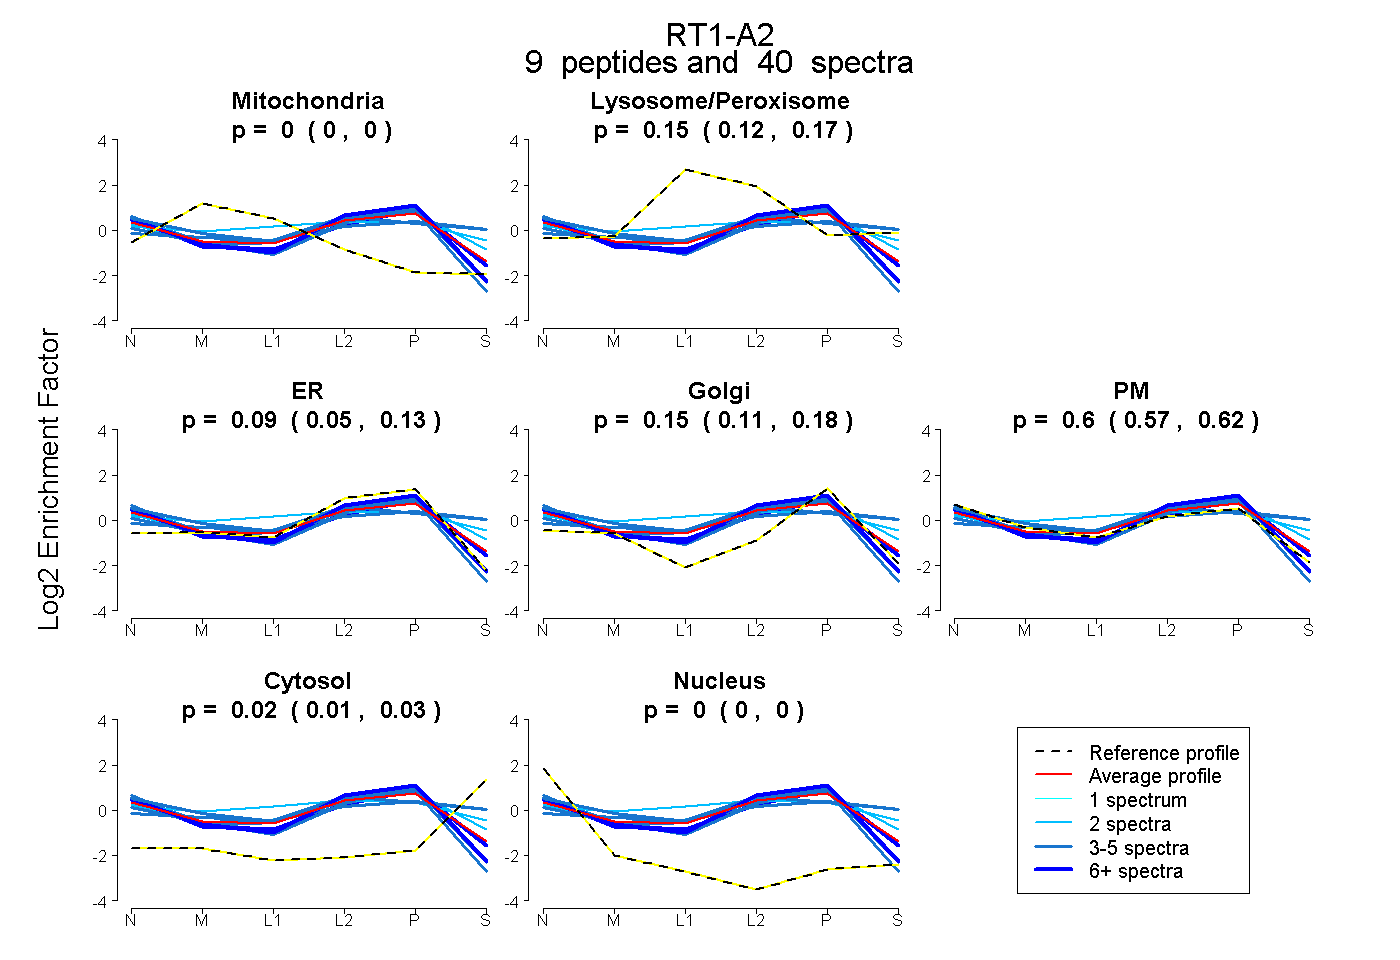
0.000 | 0.000
0.121 | 0.166
0.054 | 0.126
0.107 | 0.182
0.568 | 0.622
0.005 | 0.027
0.000 | 0.000
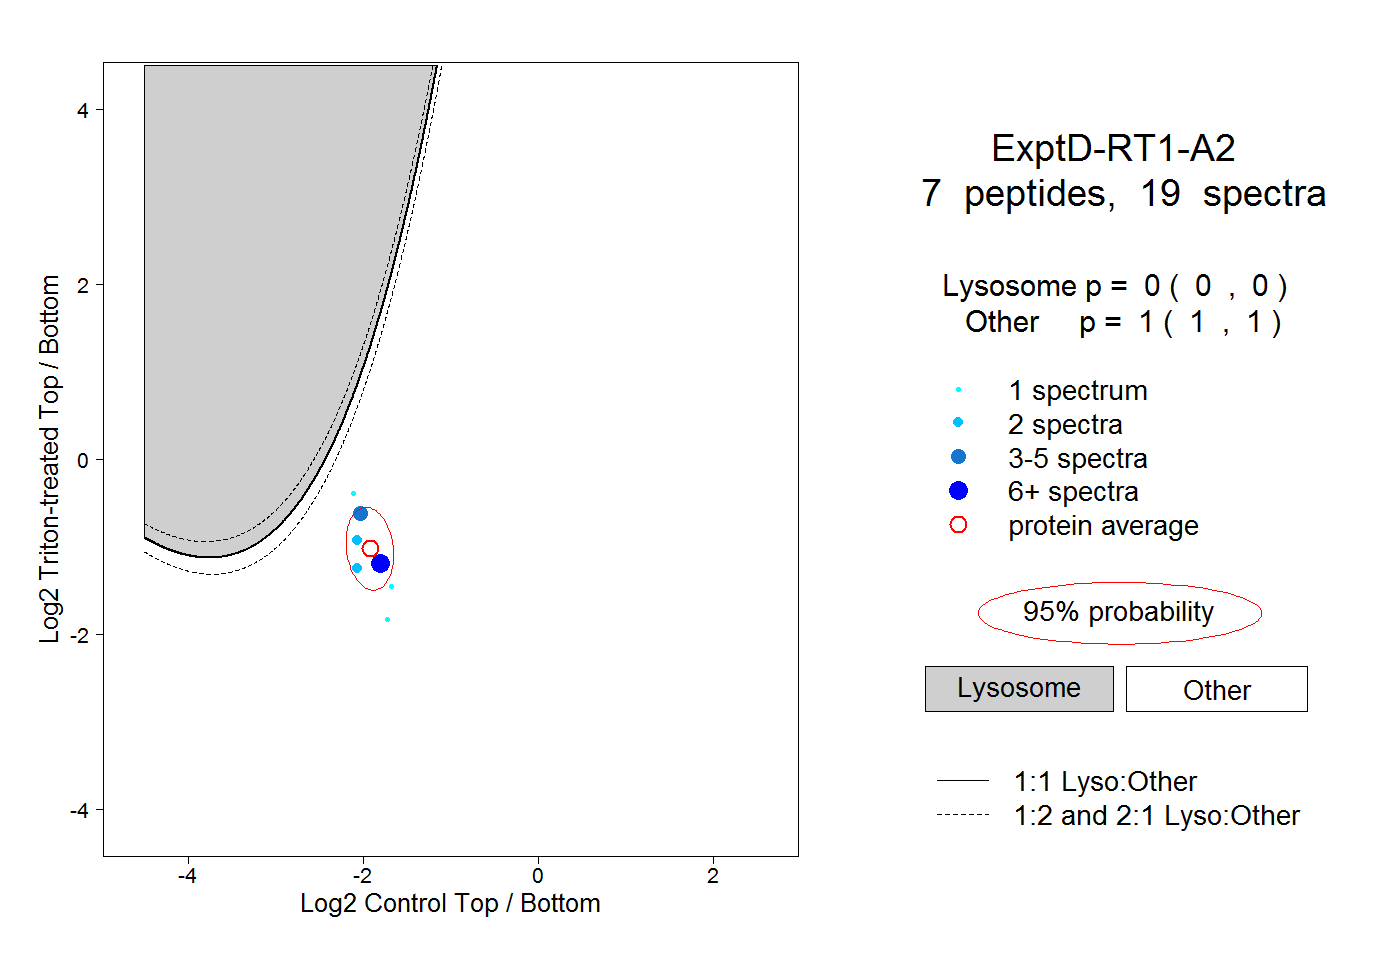
12peptides
spectra
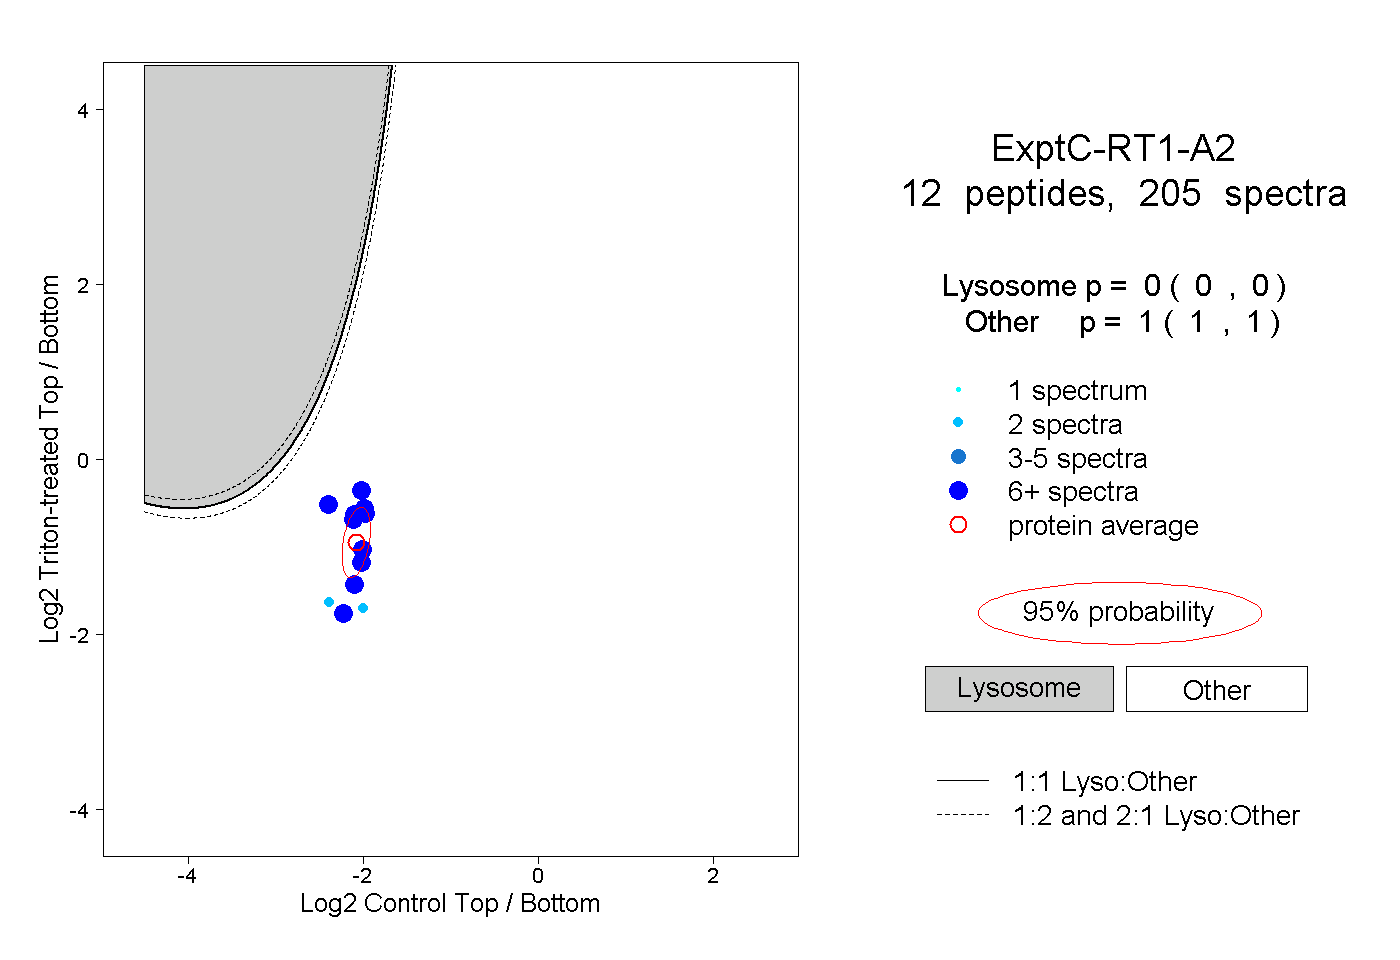
0.000 | 0.000
1.000 | 1.000