 11
11peptides
spectra
0.000 | 0.000
0.163 | 0.168
0.000 | 0.000
0.013 | 0.027
0.000 | 0.000
0.807 | 0.819
0.000 | 0.000
0.000 | 0.000
| Plot | Mito | Lyso | Perox | ER | Golgi | PM | Cytosol | Nucleus | |||||
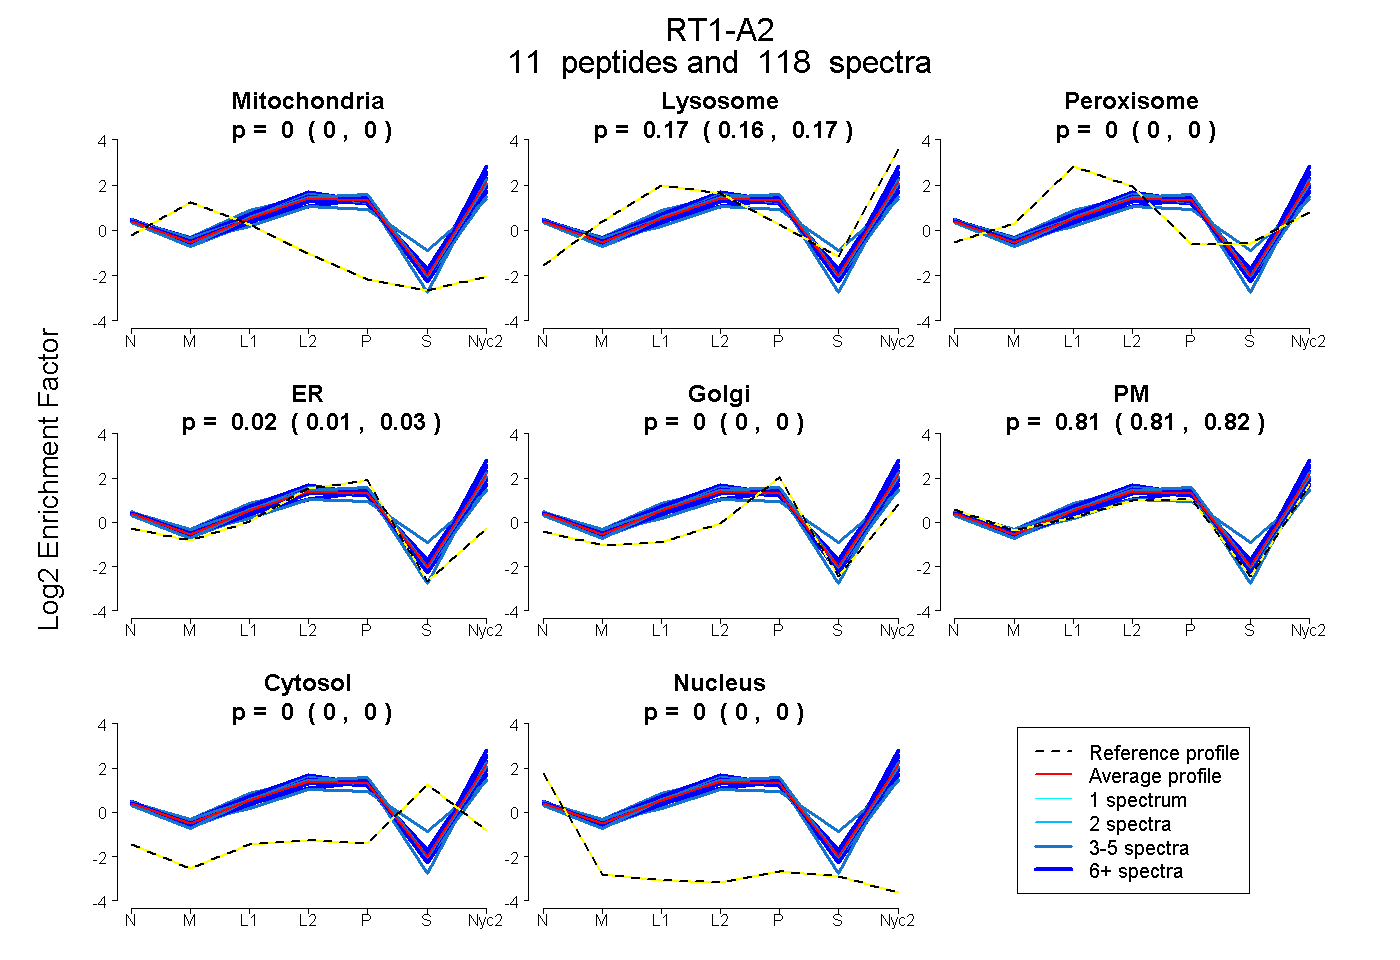
| Expt A |
11 peptides |
118 spectra |
|
0.000 0.000 | 0.000 |
0.165 0.163 | 0.168 |
0.000 0.000 | 0.000 |
0.021 0.013 | 0.027 |
0.000 0.000 | 0.000 |
0.813 0.807 | 0.819 |
0.000 0.000 | 0.000 |
0.000 0.000 | 0.000 |
| 55 spectra, EGPEYWER | 0.000 | 0.242 | 0.000 | 0.000 | 0.000 | 0.758 | 0.000 | 0.000 | ||
| 4 spectra, WASVVVPLGK | 0.000 | 0.117 | 0.000 | 0.006 | 0.000 | 0.878 | 0.000 | 0.000 | ||
| 3 spectra, GVYAPAPGR | 0.000 | 0.040 | 0.018 | 0.186 | 0.000 | 0.756 | 0.000 | 0.000 | ||
| 3 spectra, VEHEGLPEPLSQR | 0.000 | 0.046 | 0.115 | 0.000 | 0.000 | 0.687 | 0.153 | 0.000 | ||
| 4 spectra, ETQNAK | 0.000 | 0.253 | 0.000 | 0.000 | 0.000 | 0.747 | 0.000 | 0.000 | ||
| 3 spectra, YMEVGYVDDTQFVR | 0.000 | 0.167 | 0.000 | 0.114 | 0.000 | 0.719 | 0.000 | 0.000 | ||
| 7 spectra, GDYTPAPGR | 0.000 | 0.058 | 0.000 | 0.070 | 0.049 | 0.824 | 0.000 | 0.000 | ||
| 8 spectra, TWTAADFAAQITR | 0.000 | 0.270 | 0.000 | 0.000 | 0.000 | 0.730 | 0.000 | 0.000 | ||
| 8 spectra, YLELGK | 0.000 | 0.121 | 0.000 | 0.066 | 0.036 | 0.777 | 0.000 | 0.000 | ||
| 14 spectra, YDSDAENPR | 0.000 | 0.195 | 0.000 | 0.000 | 0.000 | 0.805 | 0.000 | 0.000 | ||
| 9 spectra, DYIALNEDLK | 0.000 | 0.218 | 0.000 | 0.000 | 0.000 | 0.782 | 0.000 | 0.000 |
| Plot | Mito | Lyso or Perox | ER | Golgi | PM | Cytosol | Nucleus | ||||||
| Expt B |
9 peptides |
40 spectra |
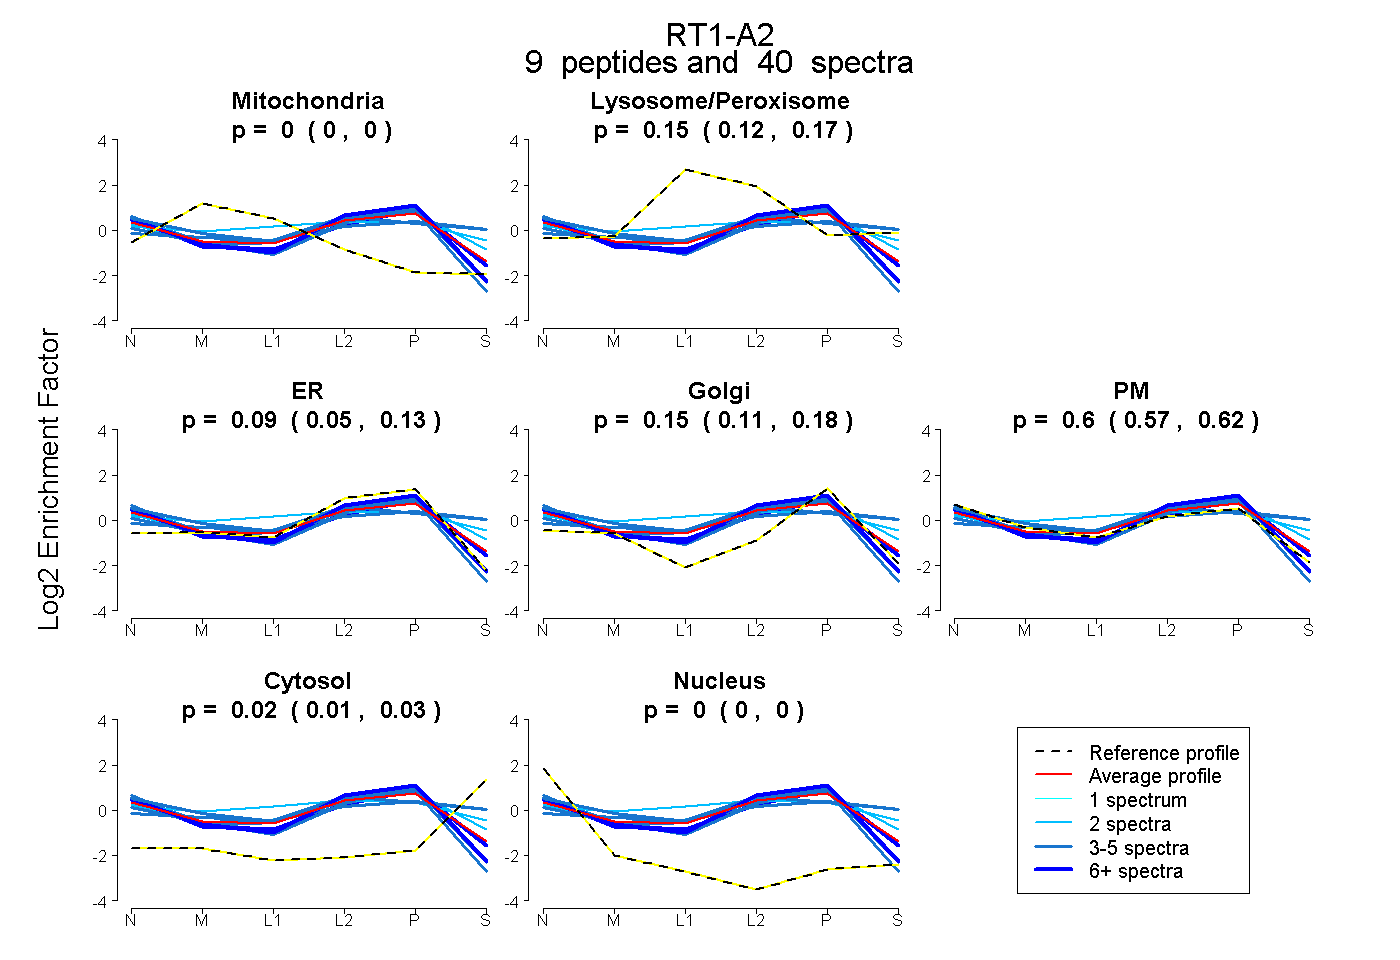 |
0.000 0.000 | 0.000 |
0.146 0.121 | 0.166 |
0.094 0.054 | 0.126 |
0.146 0.107 | 0.182 |
0.596 0.568 | 0.622 |
0.018 0.005 | 0.027 |
0.000 0.000 | 0.000 |
|||
| Plot | Lyso | Other | |||||||||||
| Expt C |
12 peptides |
205 spectra |
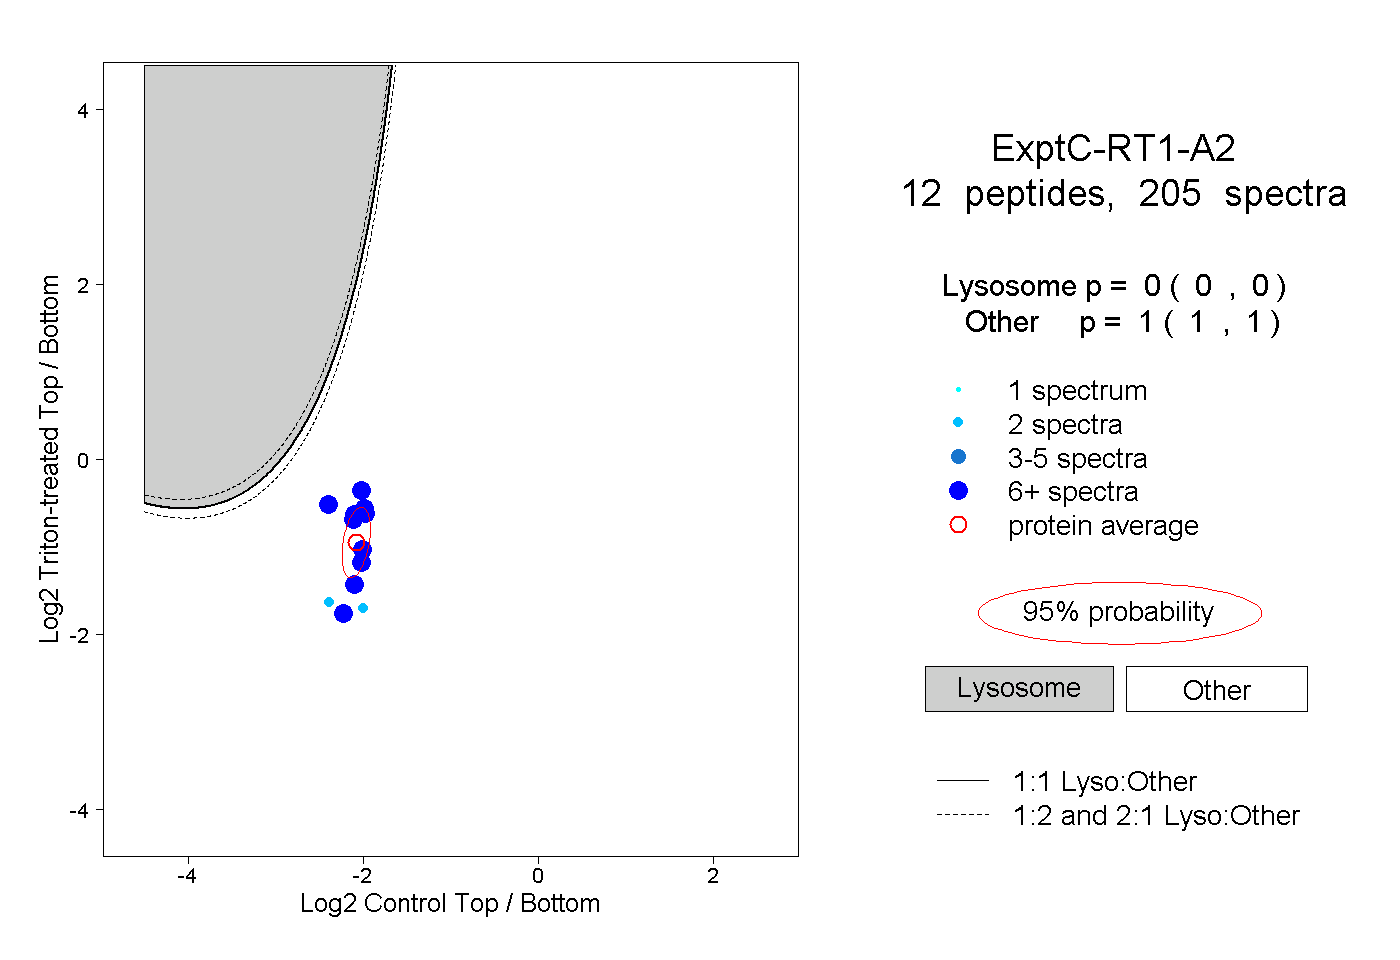 |
0.000 0.000 | 0.000 |
1.000 1.000 | 1.000 |
||||||||
| Plot | Lyso | Other | |||||||||||
| Expt D |
7 peptides |
19 spectra |
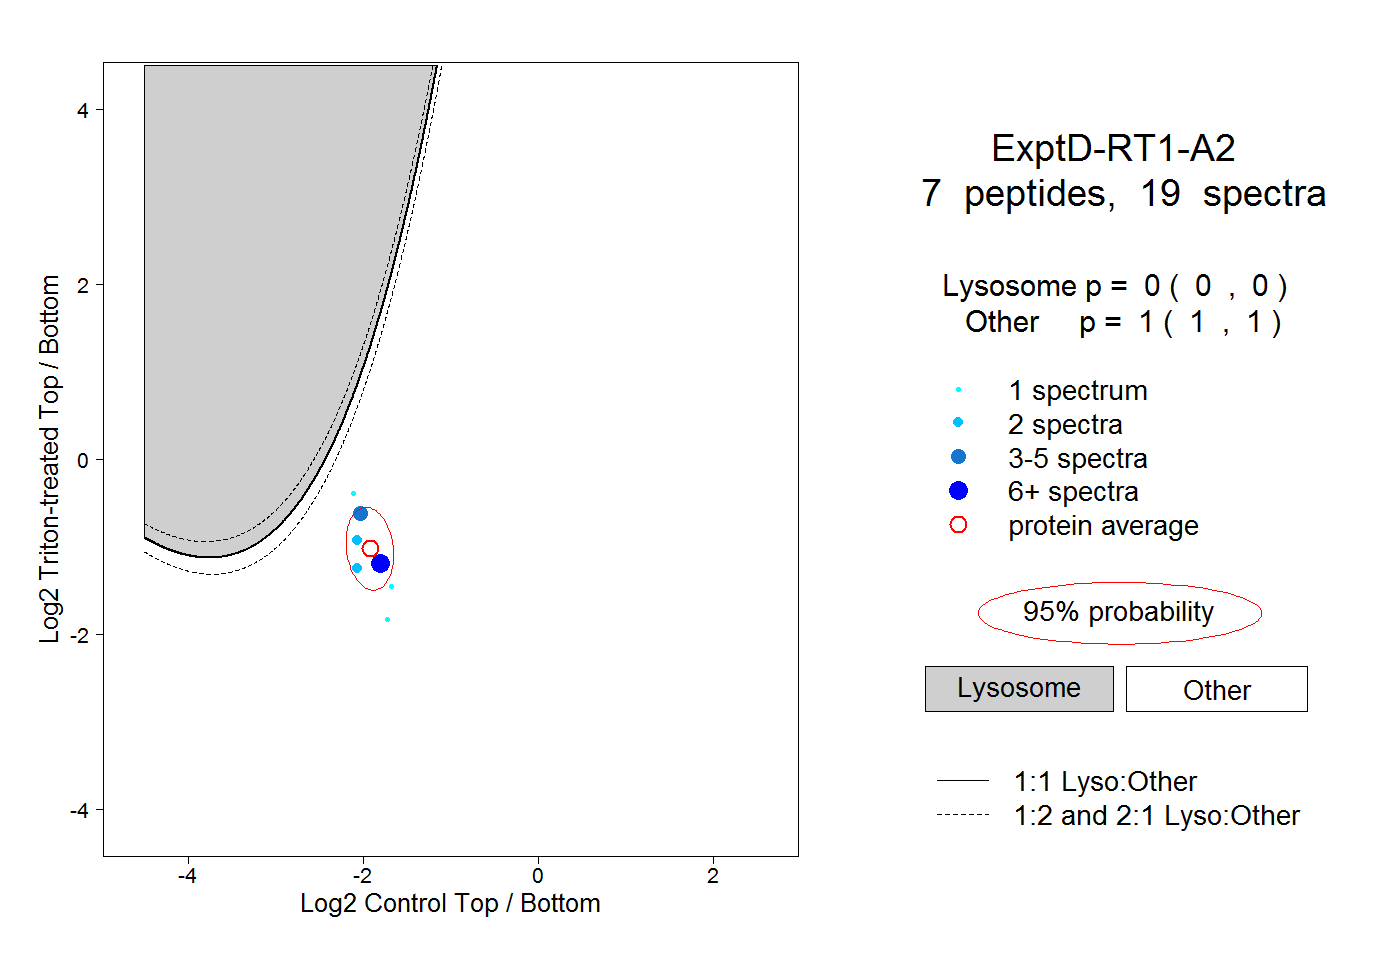 |
0.000 0.000 | 0.000 |
1.000 1.000 | 1.000 |