ALMS1
[ENSRNOP00000050674]
Main page
| | | Plot |
Mito |
Lyso |
|
Perox |
ER |
Golgi |
PM |
Cytosol |
Nucleus |
|
| Expt A |
 3
3
peptides |
8
spectra |
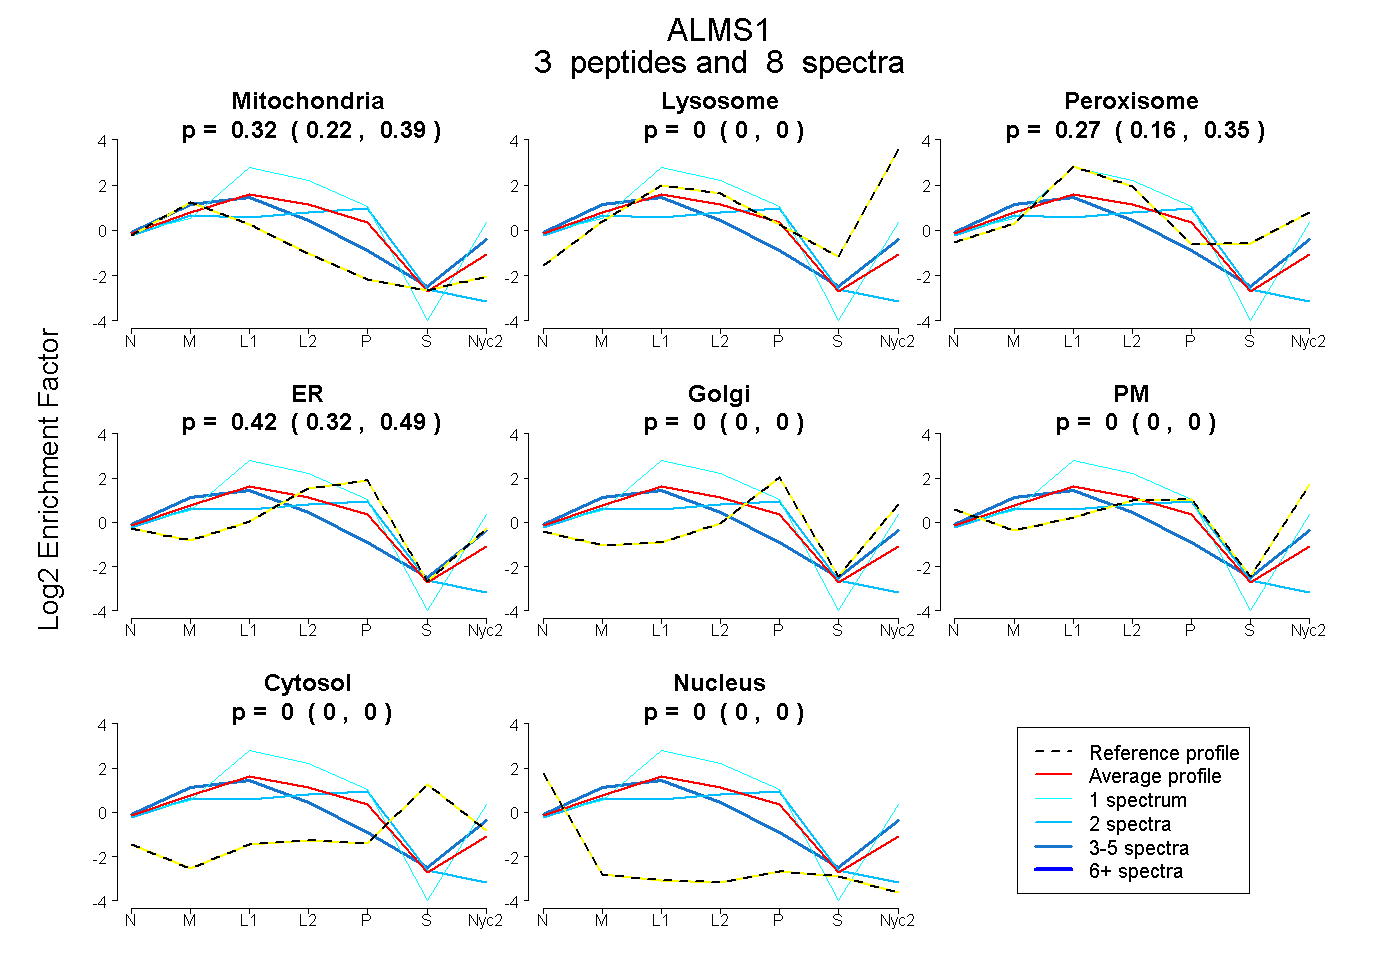 |
0.316
0.222 | 0.395 |
0.000
0.000 | 0.000 |
|
0.265
0.161 | 0.354 |
0.419
0.317 | 0.495 |
0.000
0.000 | 0.000 |
0.000
0.000 | 0.000 |
0.000
0.000 | 0.000 |
0.000
0.000 | 0.000 |
|
| | | Plot |
Mito |
|
Lyso or Perox |
|
ER |
Golgi |
PM |
Cytosol |
Nucleus |
|
| Expt B |
3
peptides |
3
spectra |
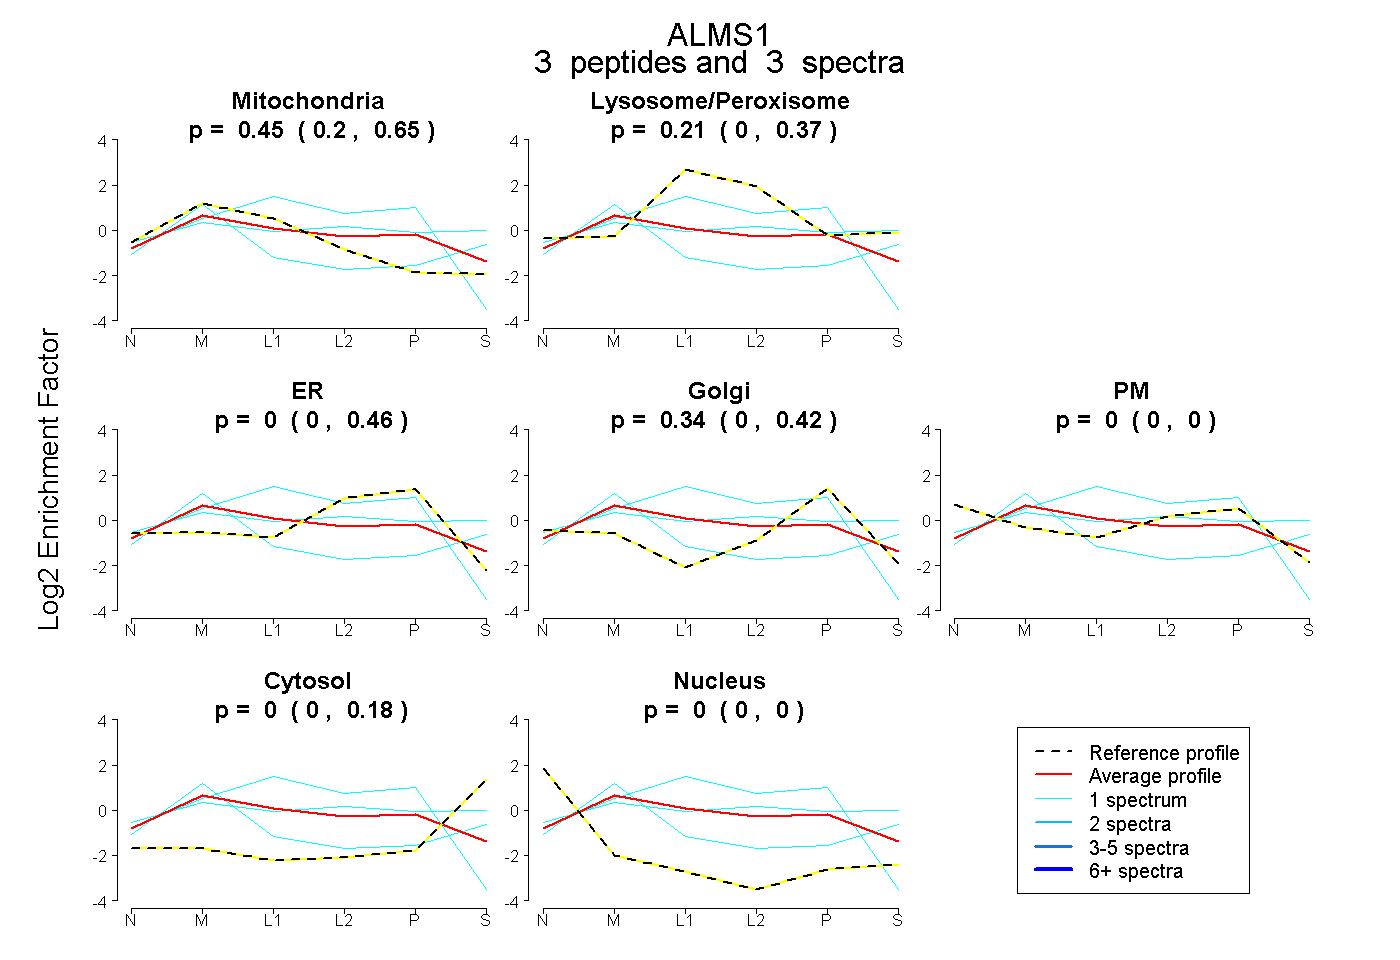 |
0.451
0.204 | 0.652 |
|
0.209
0.000 | 0.371 |
|
0.000
0.000 | 0.459 |
0.339
0.000 | 0.418 |
0.000
0.000 | 0.000 |
0.000
0.000 | 0.178 |
0.000
0.000 | 0.000 |
|
| 1 spectrum, LVPDDIK |
0.233 |
|
0.181 |
|
0.586 |
0.000 |
0.000 |
0.000 |
0.000 |
|
| 1 spectrum, ISSPSSLQR |
0.130 |
|
0.409 |
|
0.000 |
0.268 |
0.000 |
0.194 |
0.000 |
|
| 1 spectrum, LFGHGR |
0.599 |
|
0.000 |
|
0.000 |
0.061 |
0.000 |
0.340 |
0.000 |
|
| | | Plot |
|
Lyso |
|
|
|
|
|
|
|
Other |
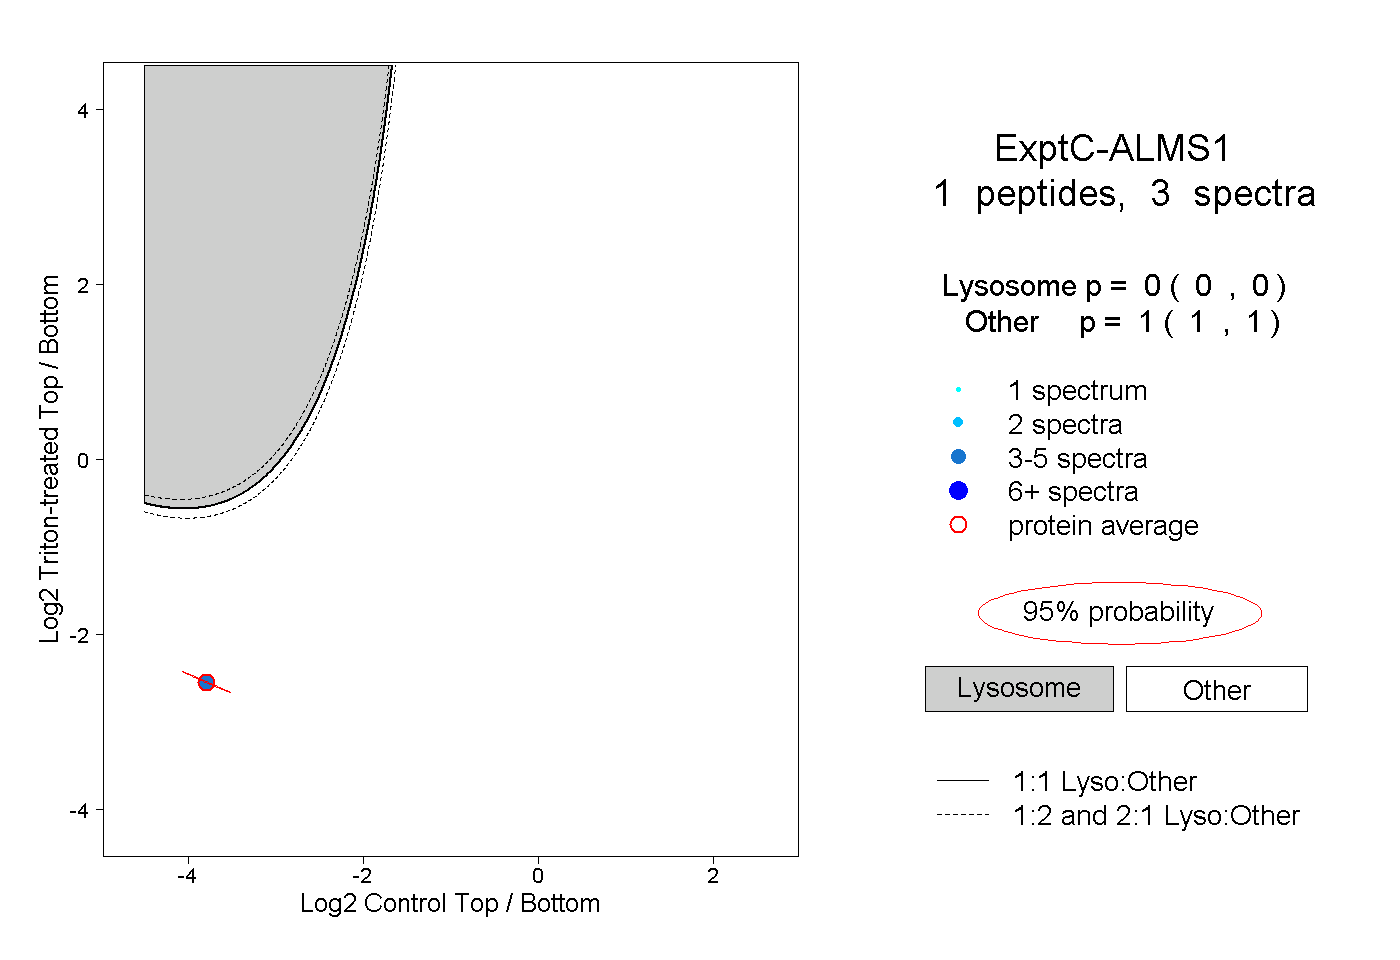
| Expt C |
1
peptide |
3
spectra |
 |
|
0.000
0.000 | 0.000 |
|
|
|
|
|
|
|
1.000
1.000 | 1.000 |