 3
3peptides
spectra
0.222 | 0.395
0.000 | 0.000
0.161 | 0.354
0.317 | 0.495
0.000 | 0.000
0.000 | 0.000
0.000 | 0.000
0.000 | 0.000
| Plot | Mito | Lyso | Perox | ER | Golgi | PM | Cytosol | Nucleus | |||||
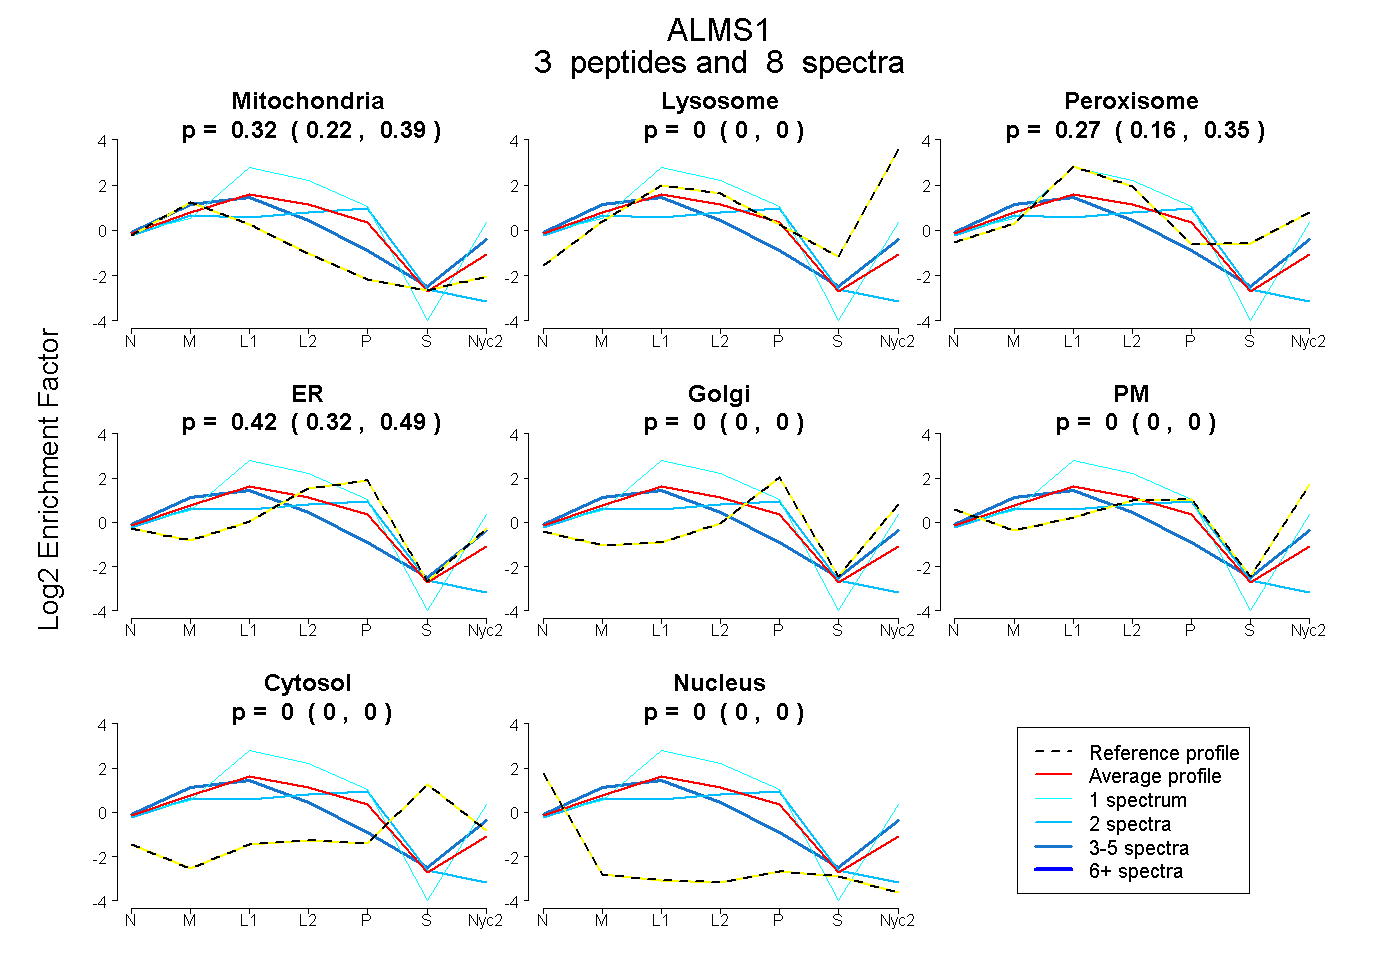
| Expt A |
3 peptides |
8 spectra |
|
0.316 0.222 | 0.395 |
0.000 0.000 | 0.000 |
0.265 0.161 | 0.354 |
0.419 0.317 | 0.495 |
0.000 0.000 | 0.000 |
0.000 0.000 | 0.000 |
0.000 0.000 | 0.000 |
0.000 0.000 | 0.000 |
| 2 spectra, LVPDDIK | 0.455 | 0.000 | 0.000 | 0.545 | 0.000 | 0.000 | 0.000 | 0.000 | ||
| 5 spectra, GSLGGPGR | 0.494 | 0.023 | 0.309 | 0.000 | 0.000 | 0.173 | 0.000 | 0.000 | ||
| 1 spectrum, SSTVPGLSDQK | 0.000 | 0.011 | 0.431 | 0.530 | 0.000 | 0.027 | 0.000 | 0.000 |
| Plot | Mito | Lyso or Perox | ER | Golgi | PM | Cytosol | Nucleus | ||||||
| Expt B |
3 peptides |
3 spectra |
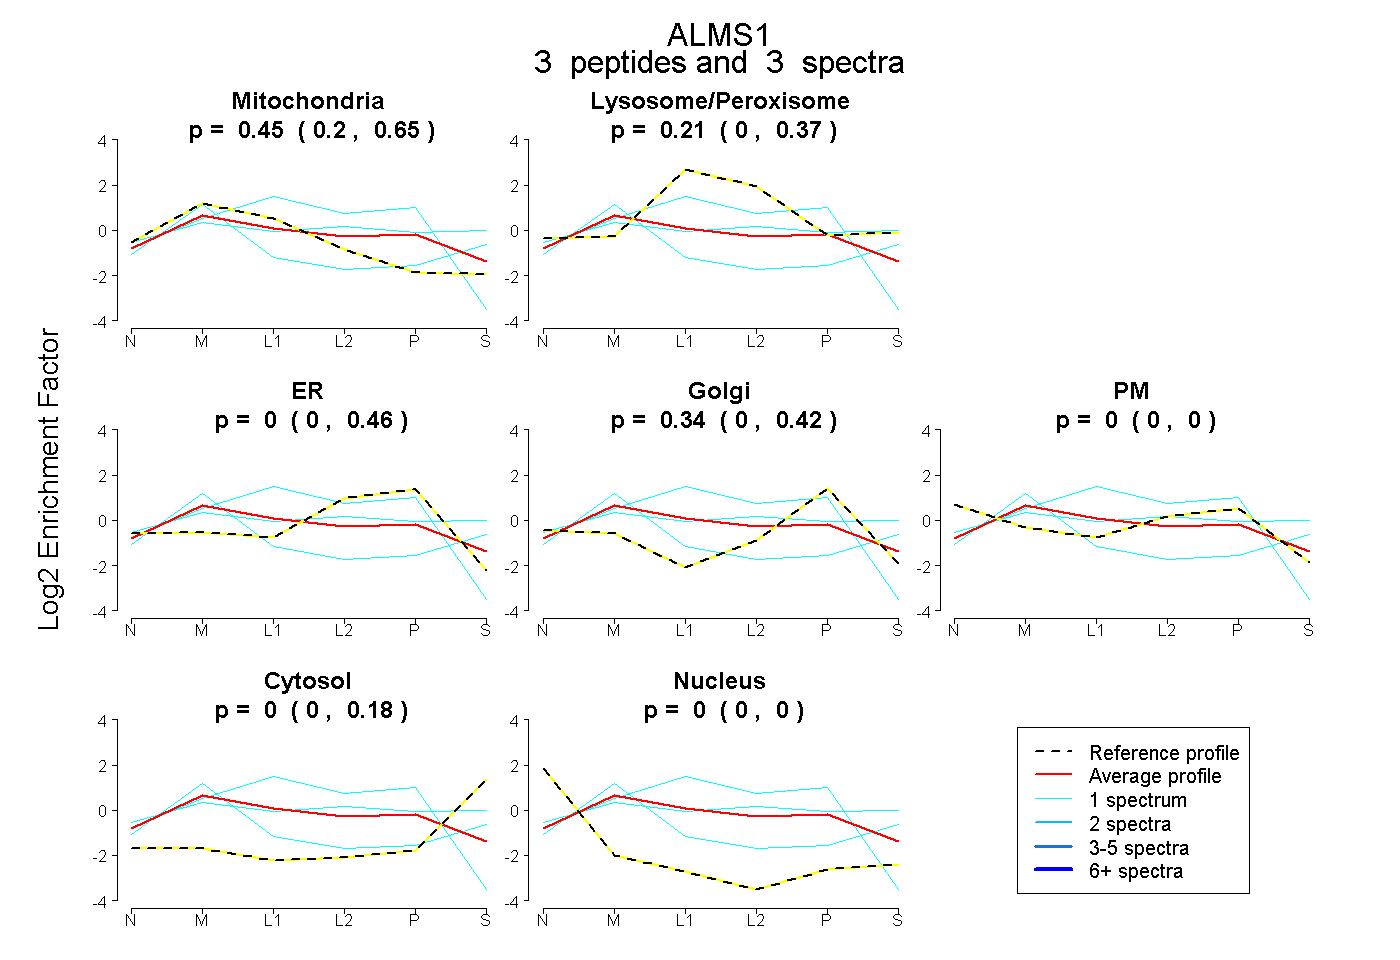 |
0.451 0.204 | 0.652 |
0.209 0.000 | 0.371 |
0.000 0.000 | 0.459 |
0.339 0.000 | 0.418 |
0.000 0.000 | 0.000 |
0.000 0.000 | 0.178 |
0.000 0.000 | 0.000 |
|||
| Plot | Lyso | Other | |||||||||||
| Expt C |
1 peptide |
3 spectra |
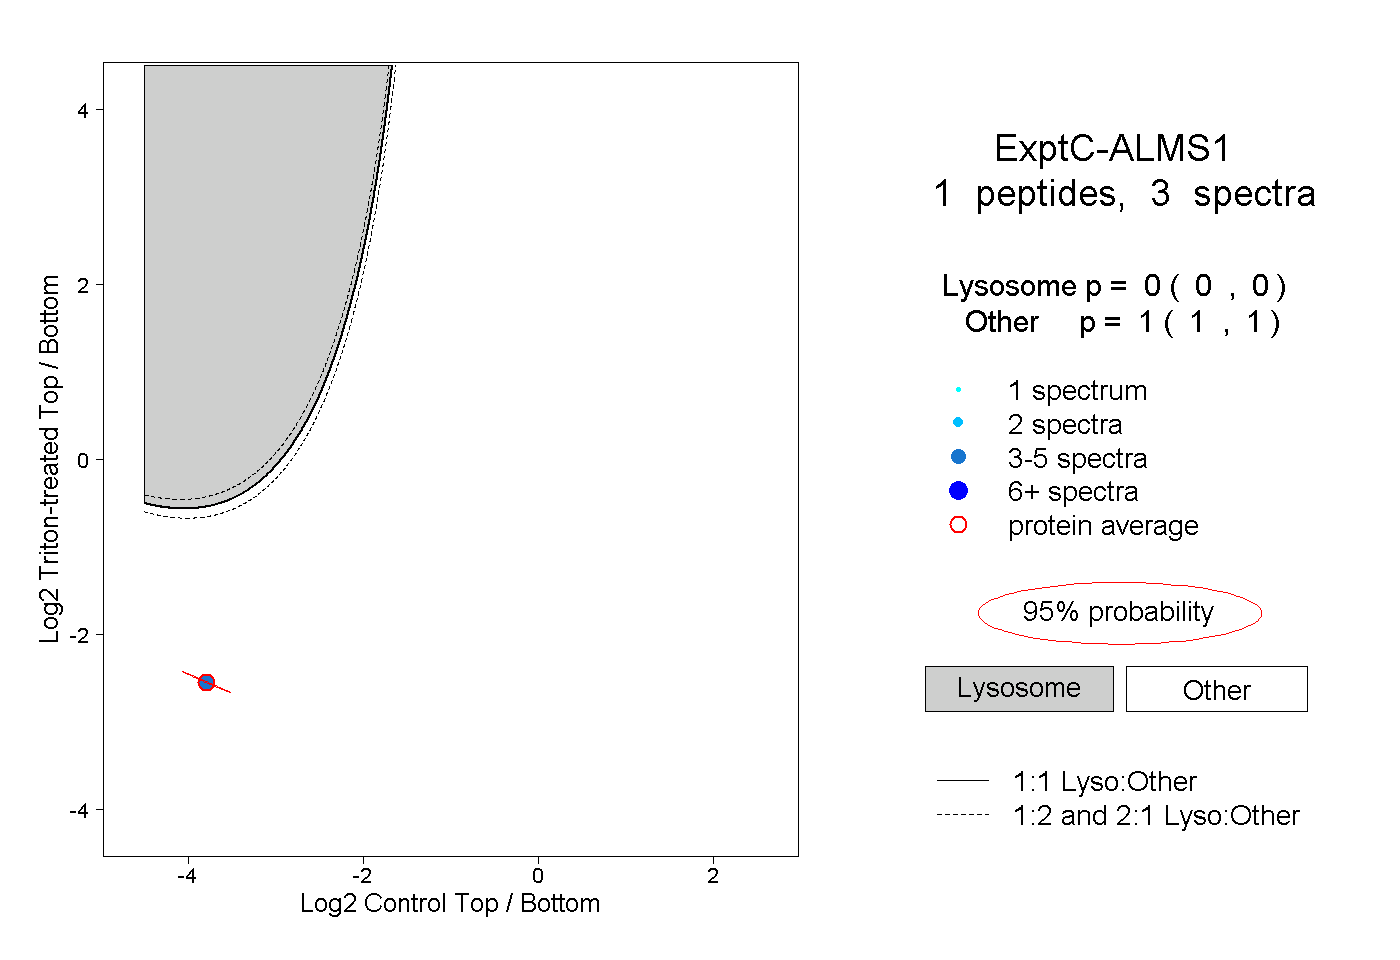 |
0.000 0.000 | 0.000 |
1.000 1.000 | 1.000 |