 3
3peptides
spectra
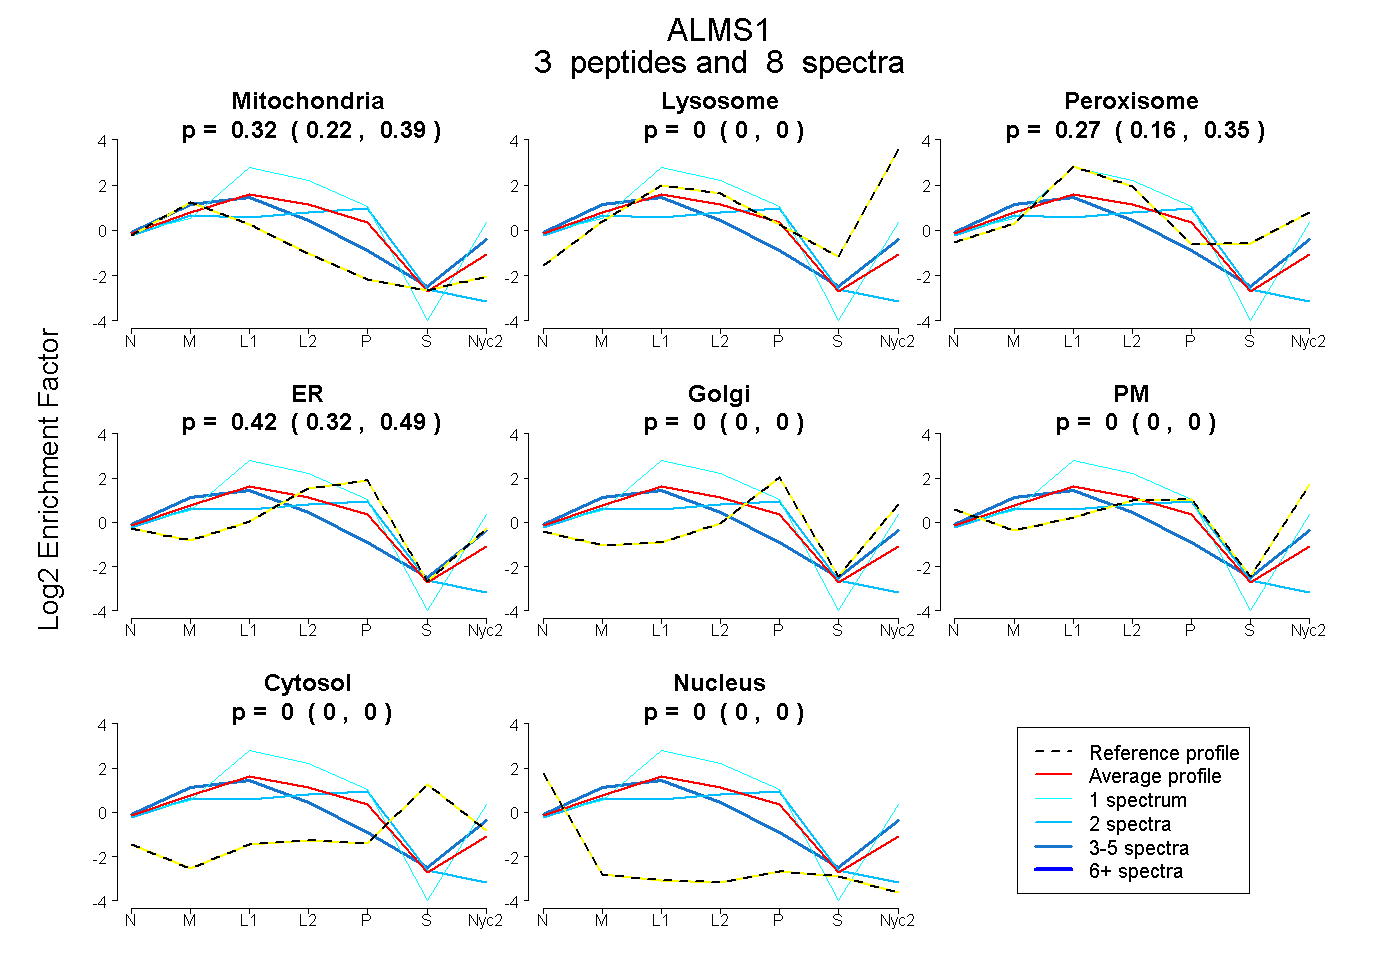
0.222 | 0.395
0.000 | 0.000
0.161 | 0.354
0.317 | 0.495
0.000 | 0.000
0.000 | 0.000
0.000 | 0.000
0.000 | 0.000
3peptides
spectra
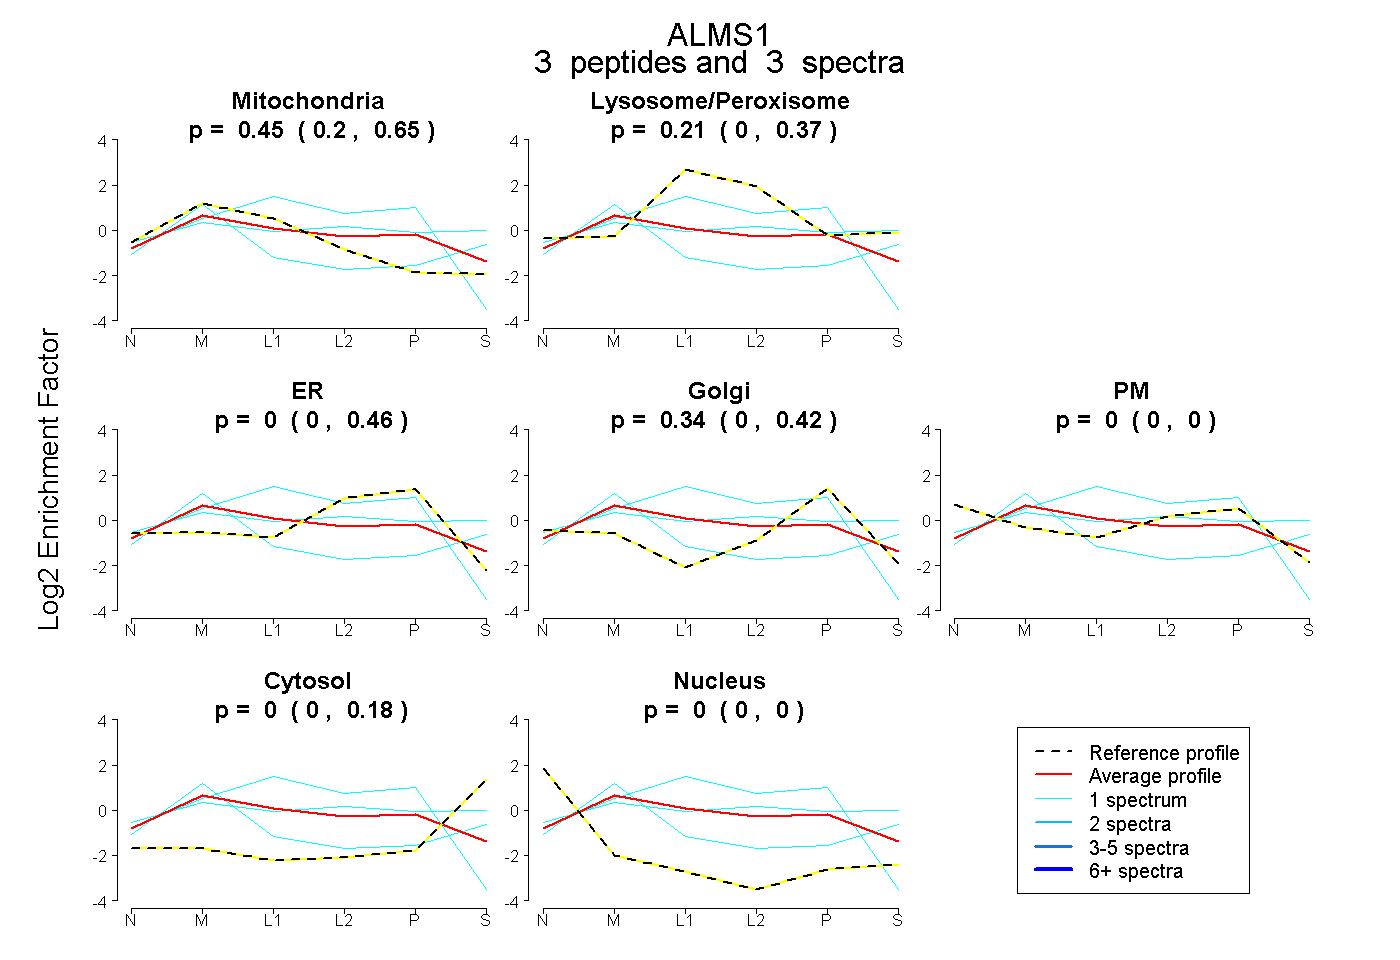
0.204 | 0.652
0.000 | 0.371
0.000 | 0.459
0.000 | 0.418
0.000 | 0.000
0.000 | 0.178
0.000 | 0.000
1peptide
spectra
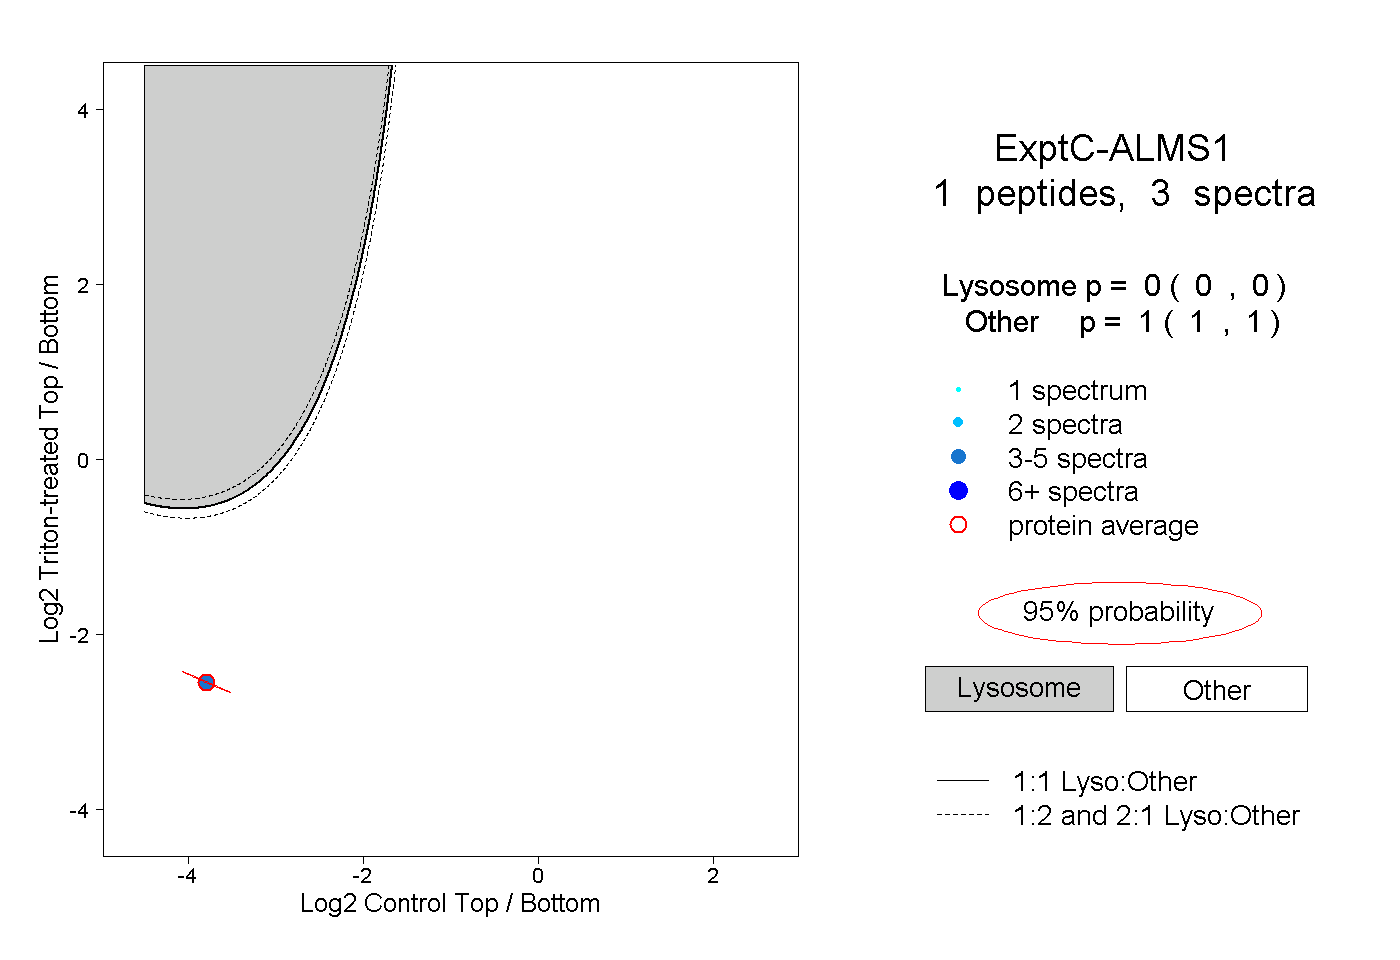
0.000 | 0.000
1.000 | 1.000