 3
3peptides
spectra
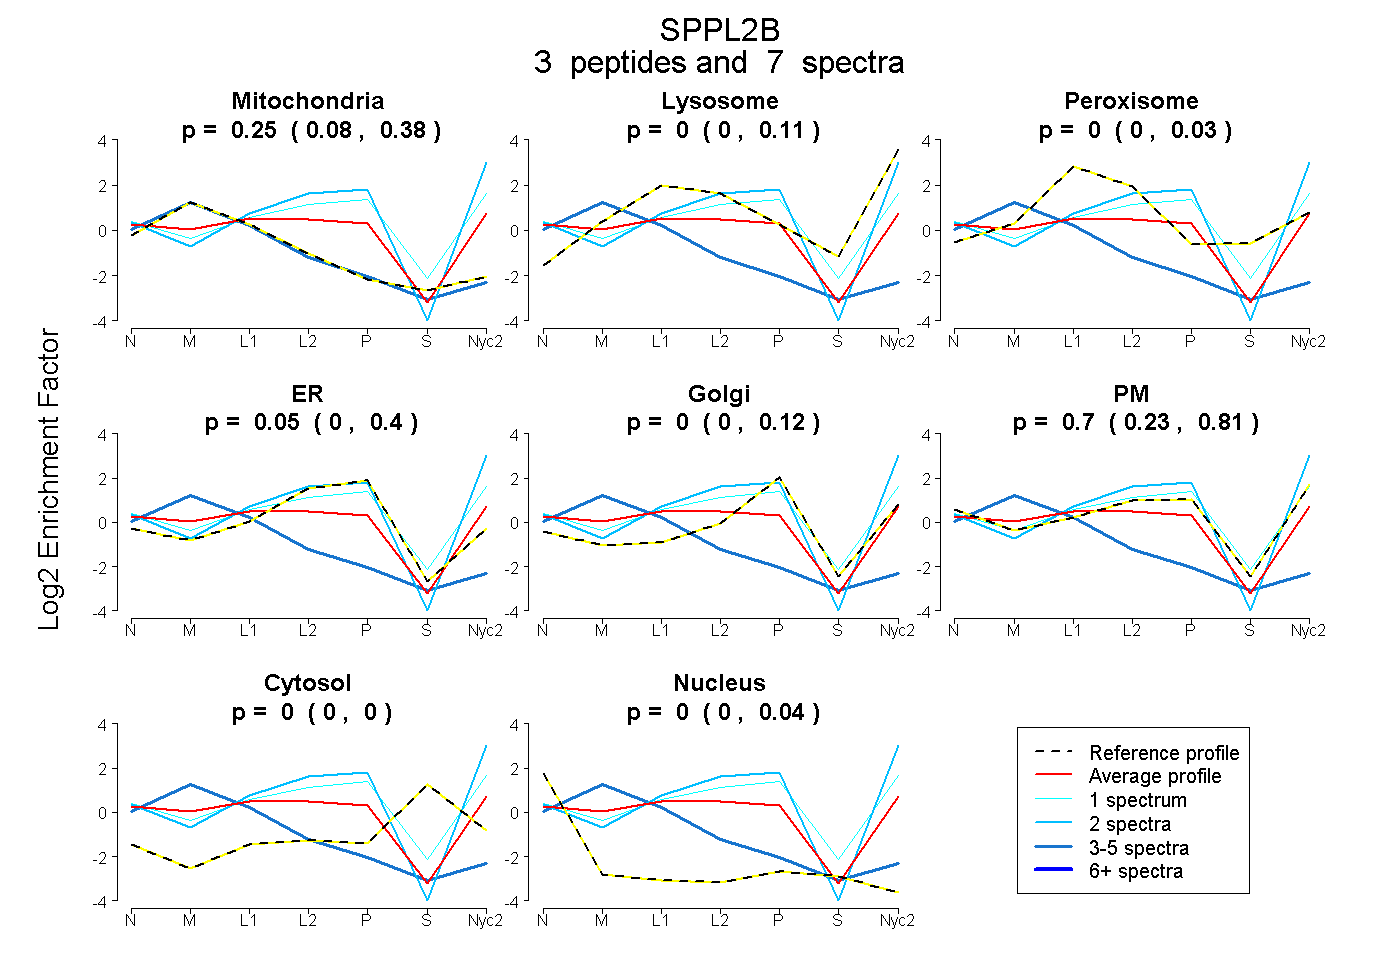
0.078 | 0.376
0.000 | 0.112
0.000 | 0.028
0.000 | 0.398
0.000 | 0.118
0.232 | 0.807
0.000 | 0.000
0.000 | 0.037
3peptides
spectra
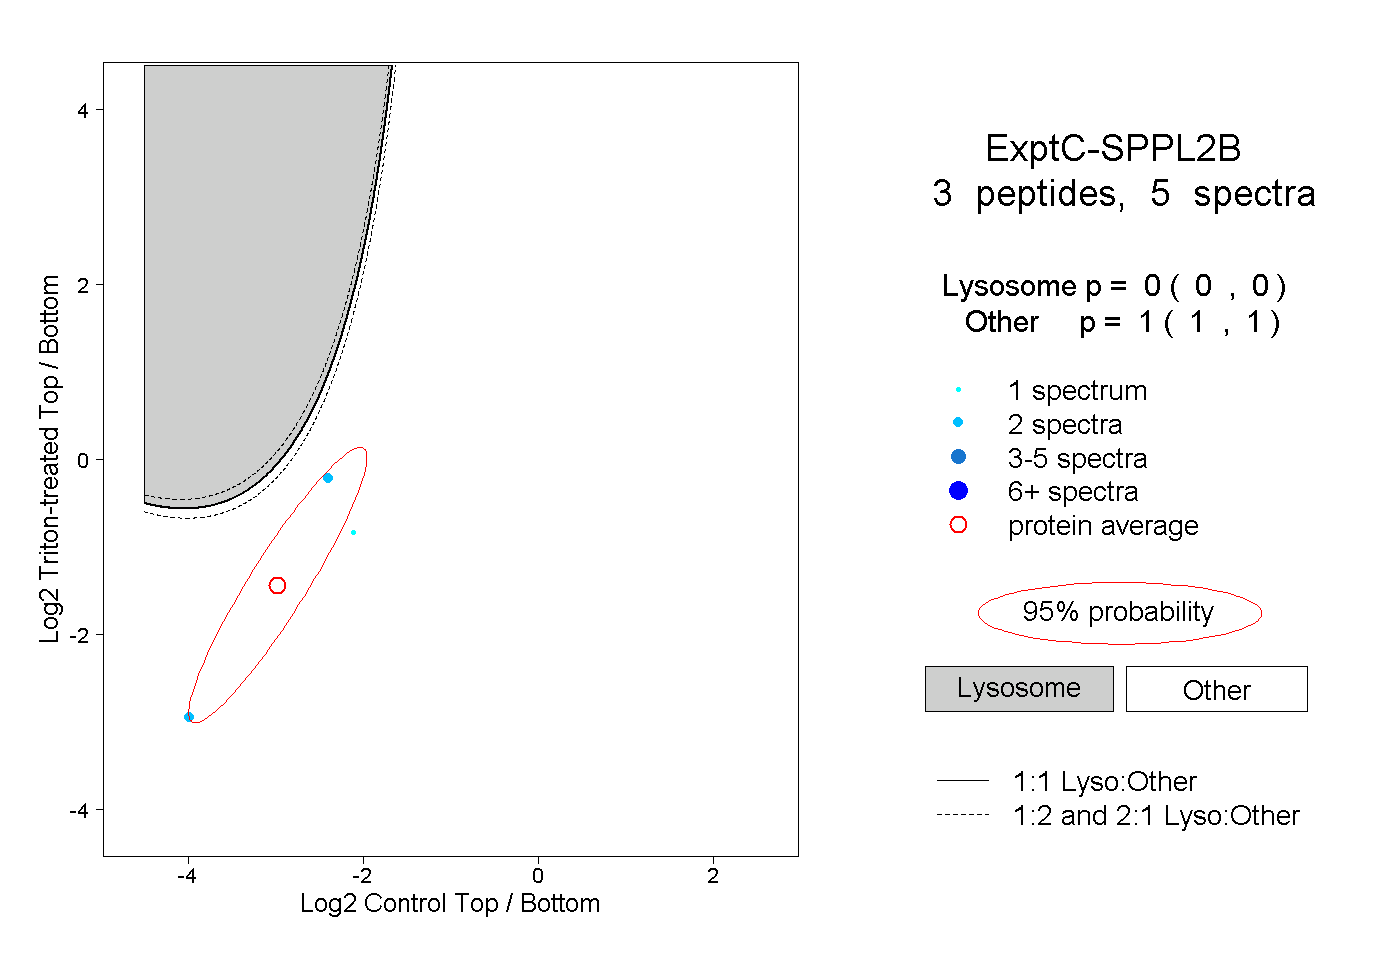
0.000 | 0.000
1.000 | 1.000
2peptides
spectra
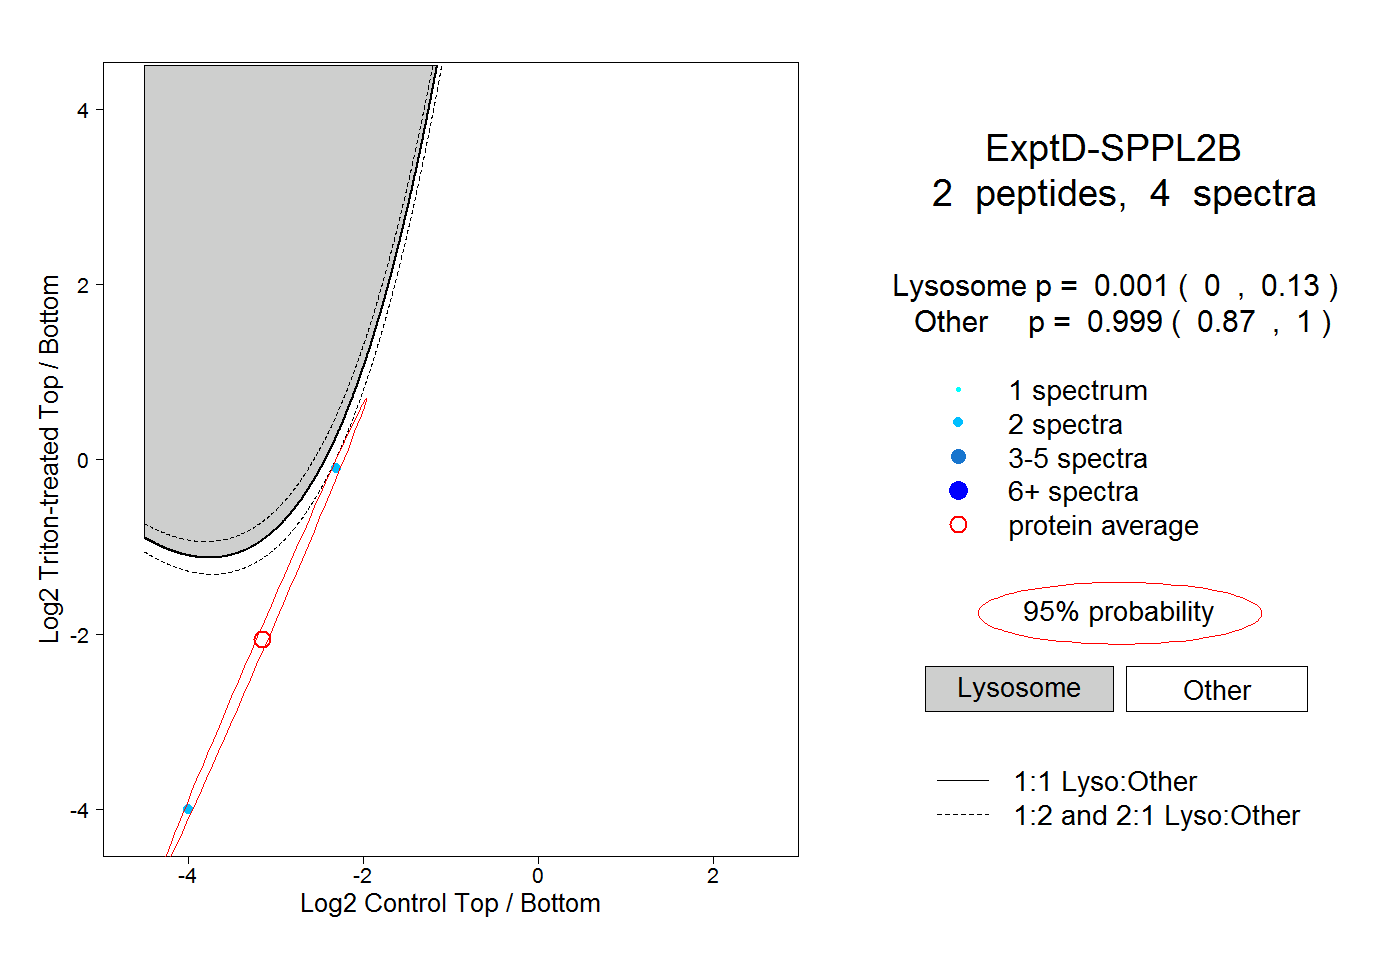
0.000 | 0.130
0.870 | 1.000