 3
3peptides
spectra
0.000 | 0.298
0.000 | 0.000
0.000 | 0.053
0.445 | 0.631
0.000 | 0.000
0.000 | 0.000
0.102 | 0.321
0.000 | 0.182
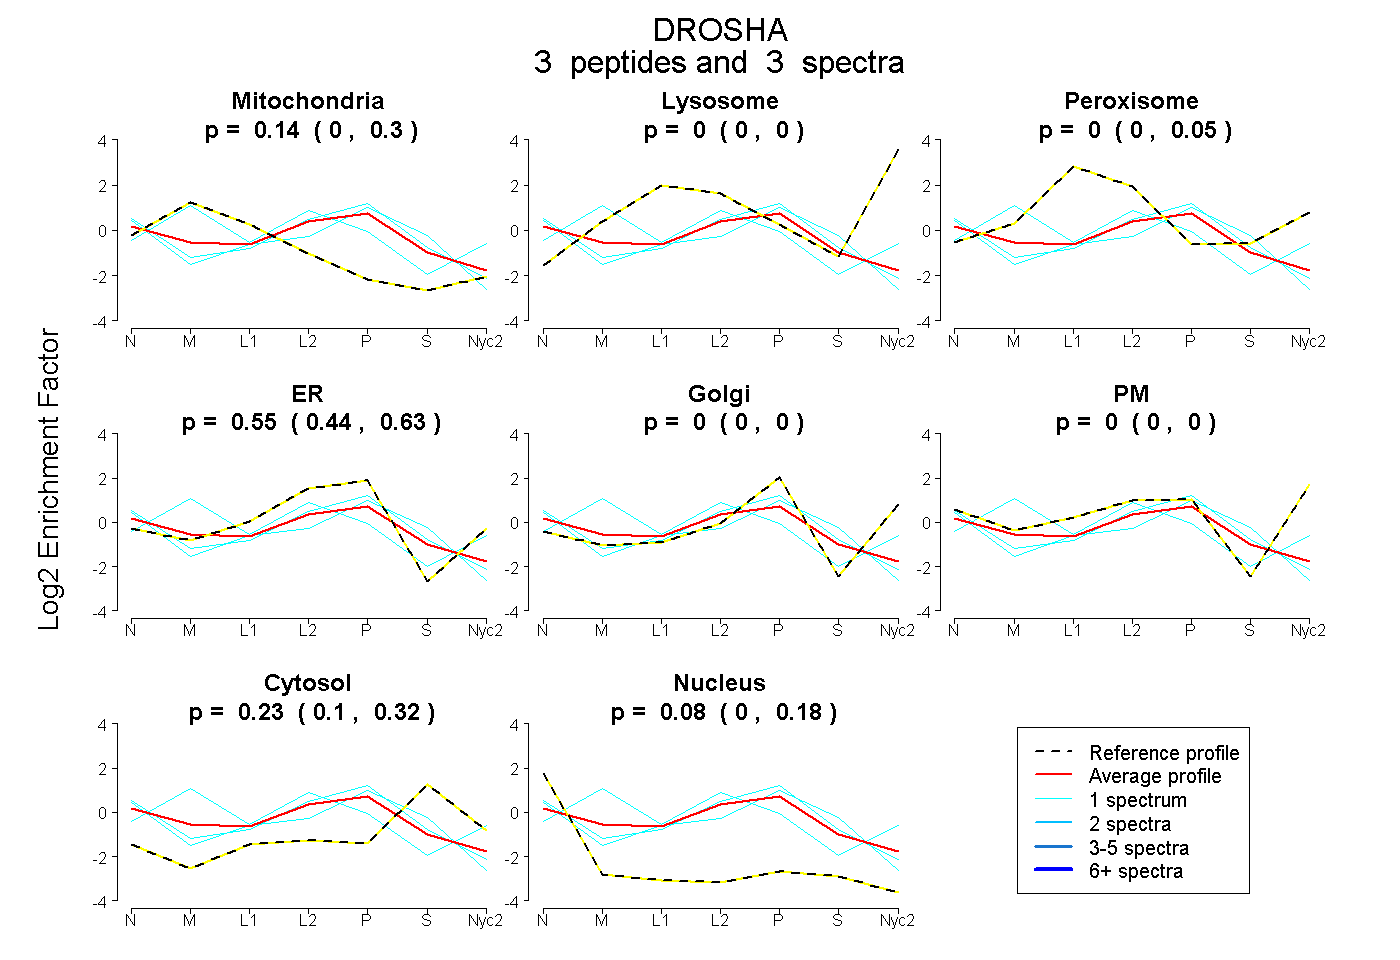
| Plot | Mito | Lyso | Perox | ER | Golgi | PM | Cytosol | Nucleus | |||||
| Expt A |
3 peptides |
3 spectra |
|
0.143 0.000 | 0.298 |
0.000 0.000 | 0.000 |
0.000 0.000 | 0.053 |
0.551 0.445 | 0.631 |
0.000 0.000 | 0.000 |
0.000 0.000 | 0.000 |
0.228 0.102 | 0.321 |
0.078 0.000 | 0.182 |
| 1 spectrum, FLPDGGK | 0.438 | 0.114 | 0.000 | 0.432 | 0.000 | 0.004 | 0.012 | 0.000 | ||
| 1 spectrum, FHFMPR | 0.000 | 0.000 | 0.000 | 0.618 | 0.000 | 0.000 | 0.232 | 0.150 | ||
| 1 spectrum, DILELYDWNLK | 0.000 | 0.000 | 0.000 | 0.480 | 0.000 | 0.000 | 0.338 | 0.182 |