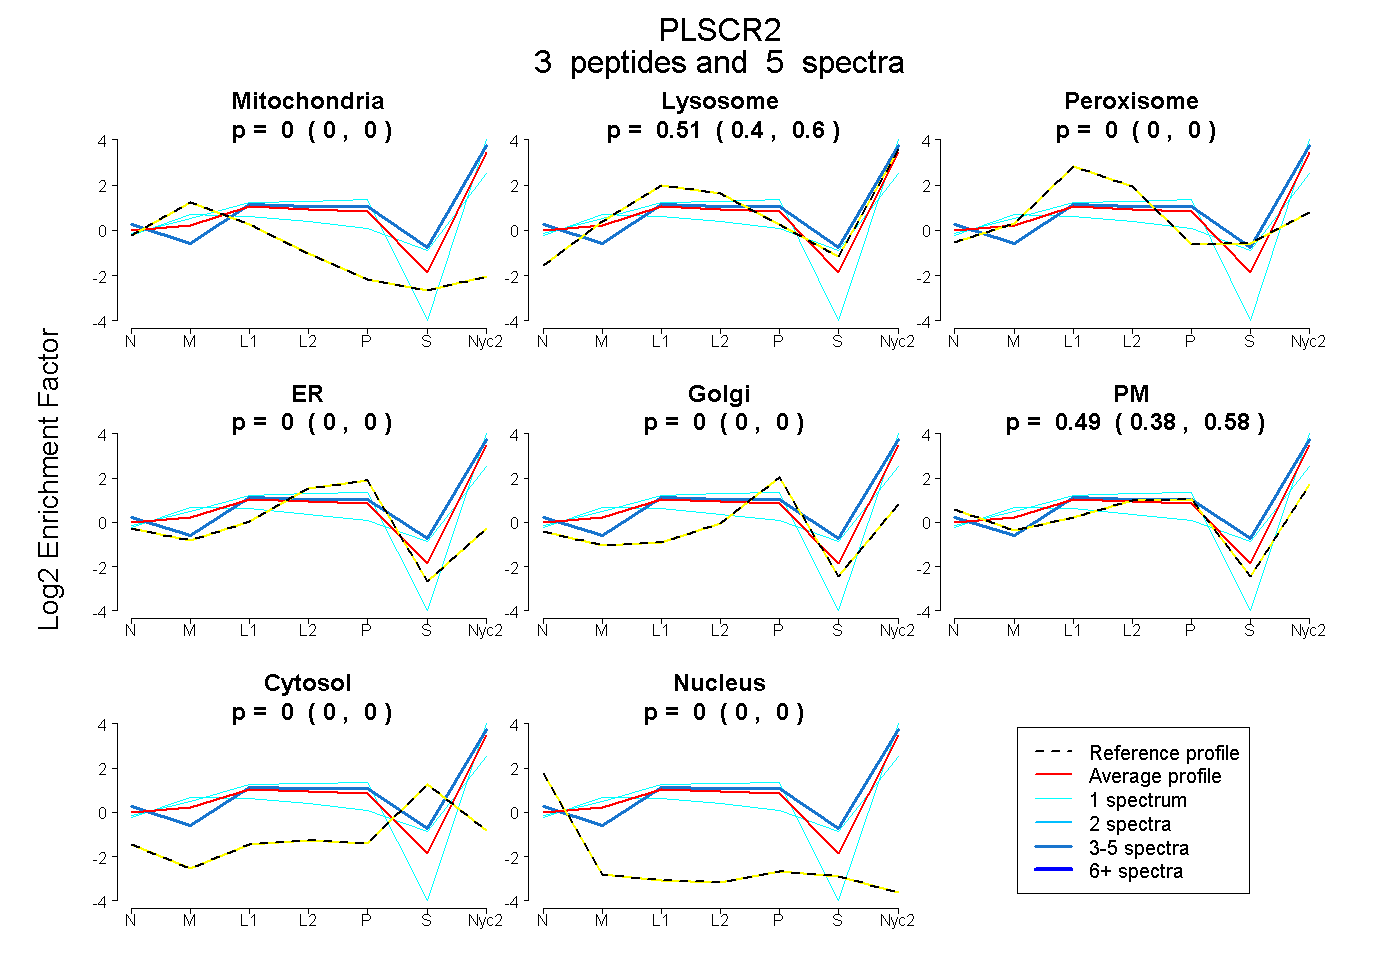
 3
3peptides
spectra
0.000 | 0.000
0.403 | 0.596
0.000 | 0.000
0.000 | 0.000
0.000 | 0.000
0.384 | 0.582
0.000 | 0.000
0.000 | 0.000
| Plot | Mito | Lyso | Perox | ER | Golgi | PM | Cytosol | Nucleus | |||||
| Expt A |
3 peptides |
5 spectra |
|
0.000 0.000 | 0.000 |
0.510 0.403 | 0.596 |
0.000 0.000 | 0.000 |
0.000 0.000 | 0.000 |
0.000 0.000 | 0.000 |
0.490 0.384 | 0.582 |
0.000 0.000 | 0.000 |
0.000 0.000 | 0.000 |
| 3 spectra, SLDEVSR | 0.000 | 0.577 | 0.000 | 0.000 | 0.000 | 0.413 | 0.010 | 0.000 | ||
| 1 spectrum, ILDHLGQEVMTLERPLR | 0.000 | 0.429 | 0.000 | 0.000 | 0.000 | 0.571 | 0.000 | 0.000 | ||
| 1 spectrum, QWSGCVK | 0.090 | 0.516 | 0.000 | 0.000 | 0.000 | 0.294 | 0.100 | 0.000 |
| Plot | Lyso | Other | |||||||||||
| Expt C |
1 peptide |
1 spectrum |
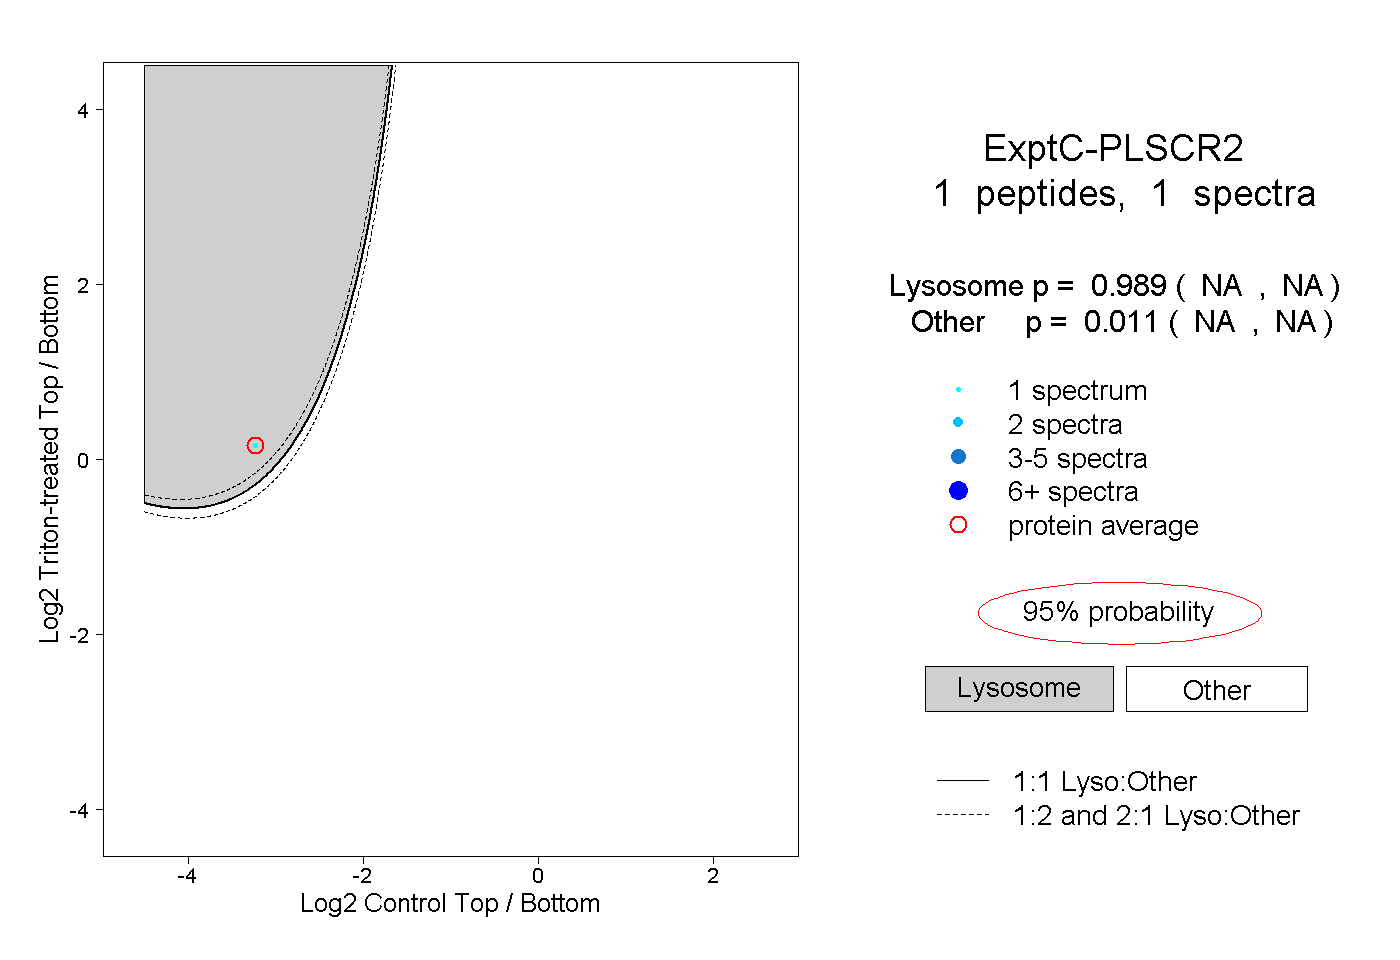 |
0.989 NA | NA |
0.011 NA | NA |