 1
1peptide
spectra
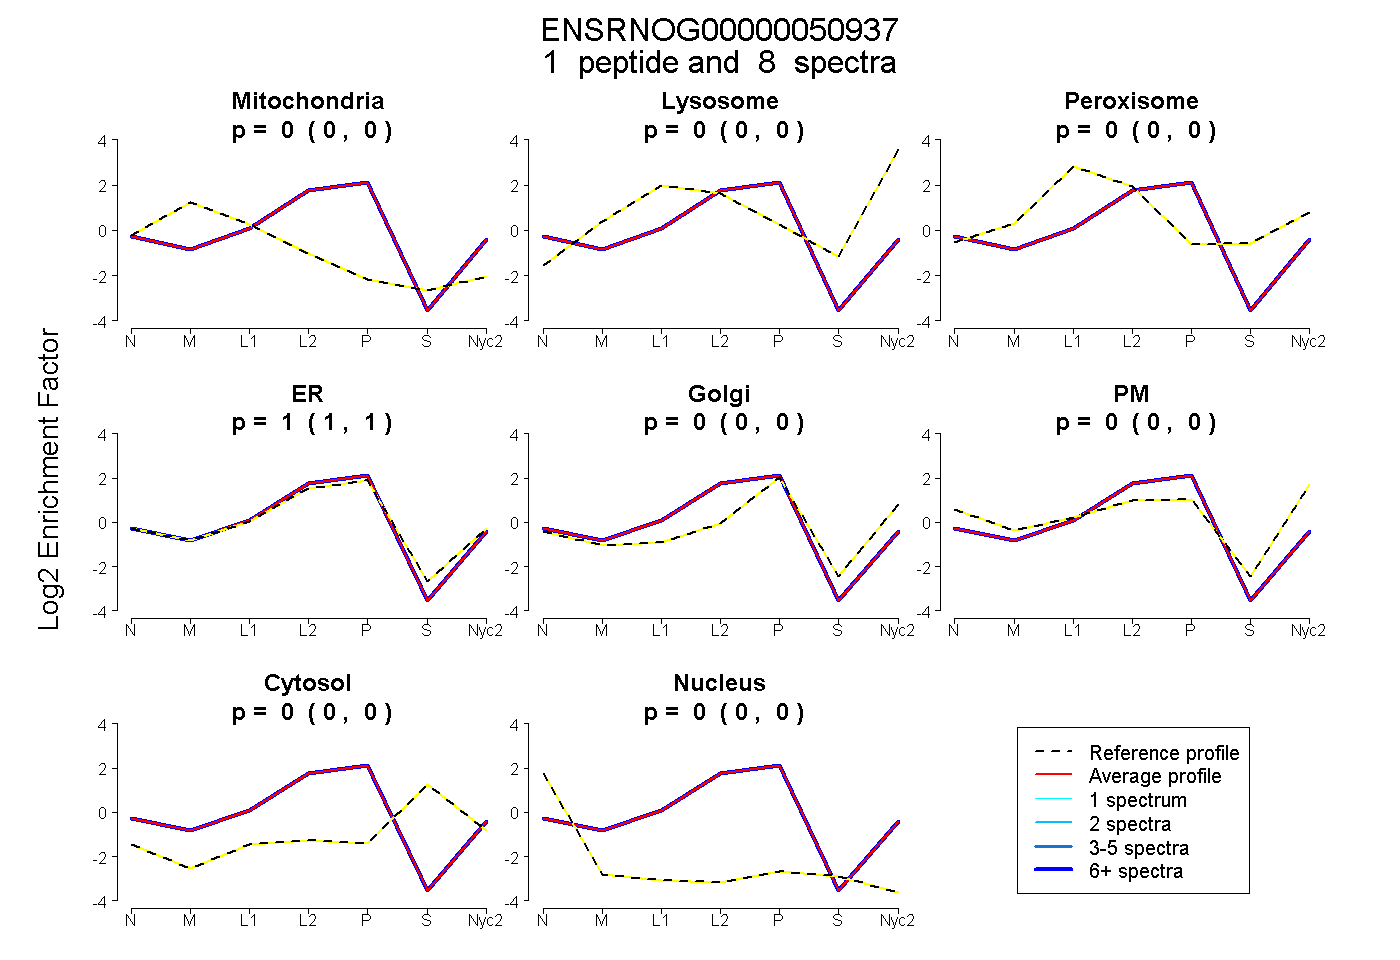
0.000 | 0.000
0.000 | 0.000
0.000 | 0.000
1.000 | 1.000
0.000 | 0.000
0.000 | 0.000
0.000 | 0.000
0.000 | 0.000
1peptide
spectra
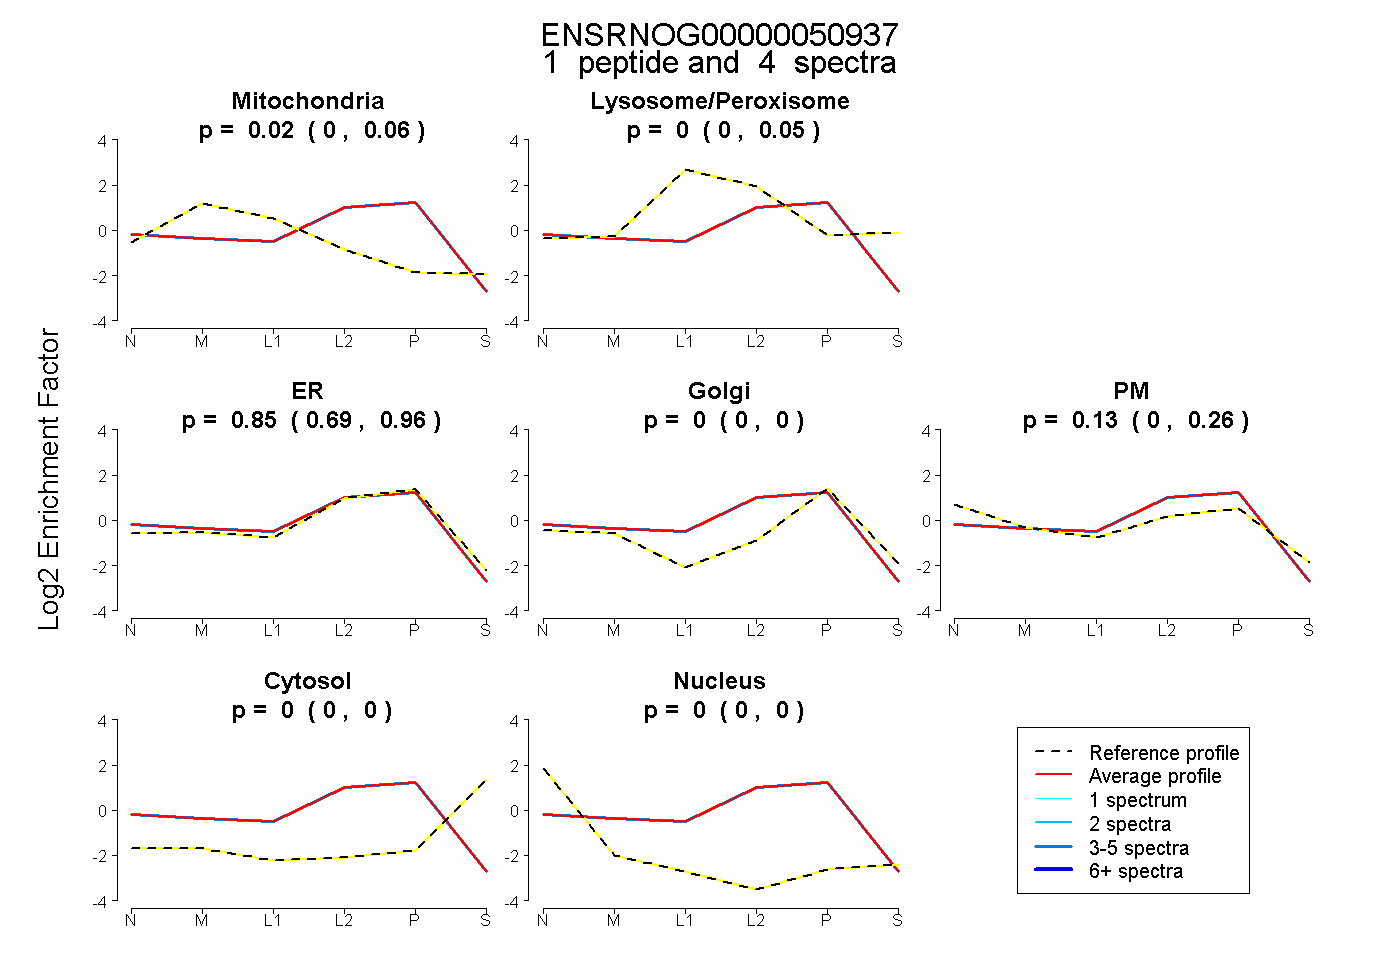
0.000 | 0.060
0.000 | 0.047
0.695 | 0.956
0.000 | 0.000
0.000 | 0.265
0.000 | 0.000
0.000 | 0.000
1peptide
spectra
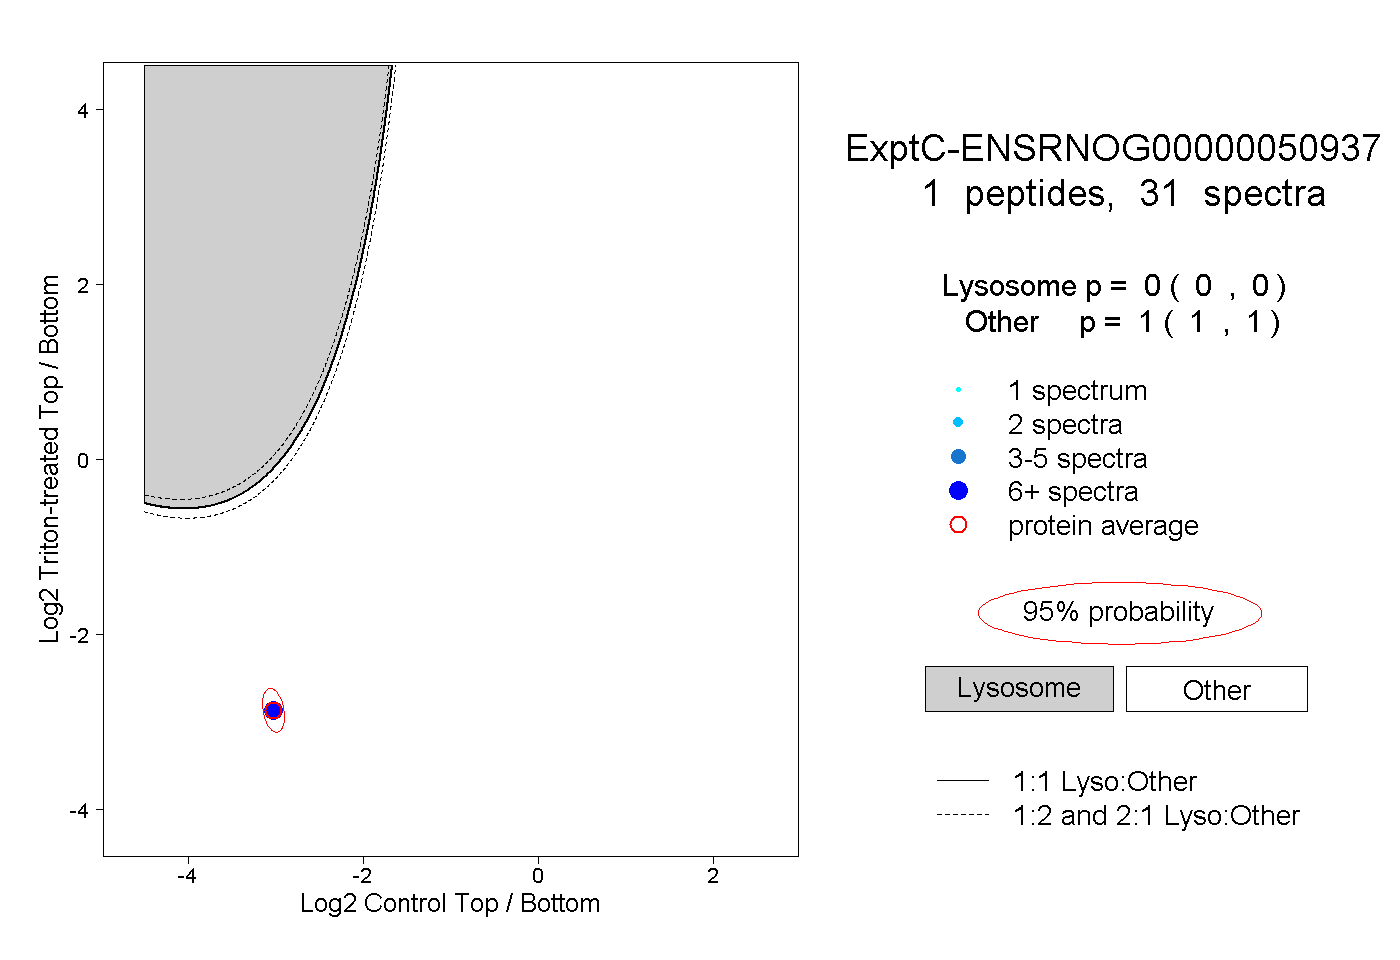
0.000 | 0.000
1.000 | 1.000