IDS
[ENSRNOP00000050409]
Main page
| | | Plot |
Mito |
Lyso |
|
Perox |
ER |
Golgi |
PM |
Cytosol |
Nucleus |
|
| Expt A |
 4
4
peptides |
12
spectra |
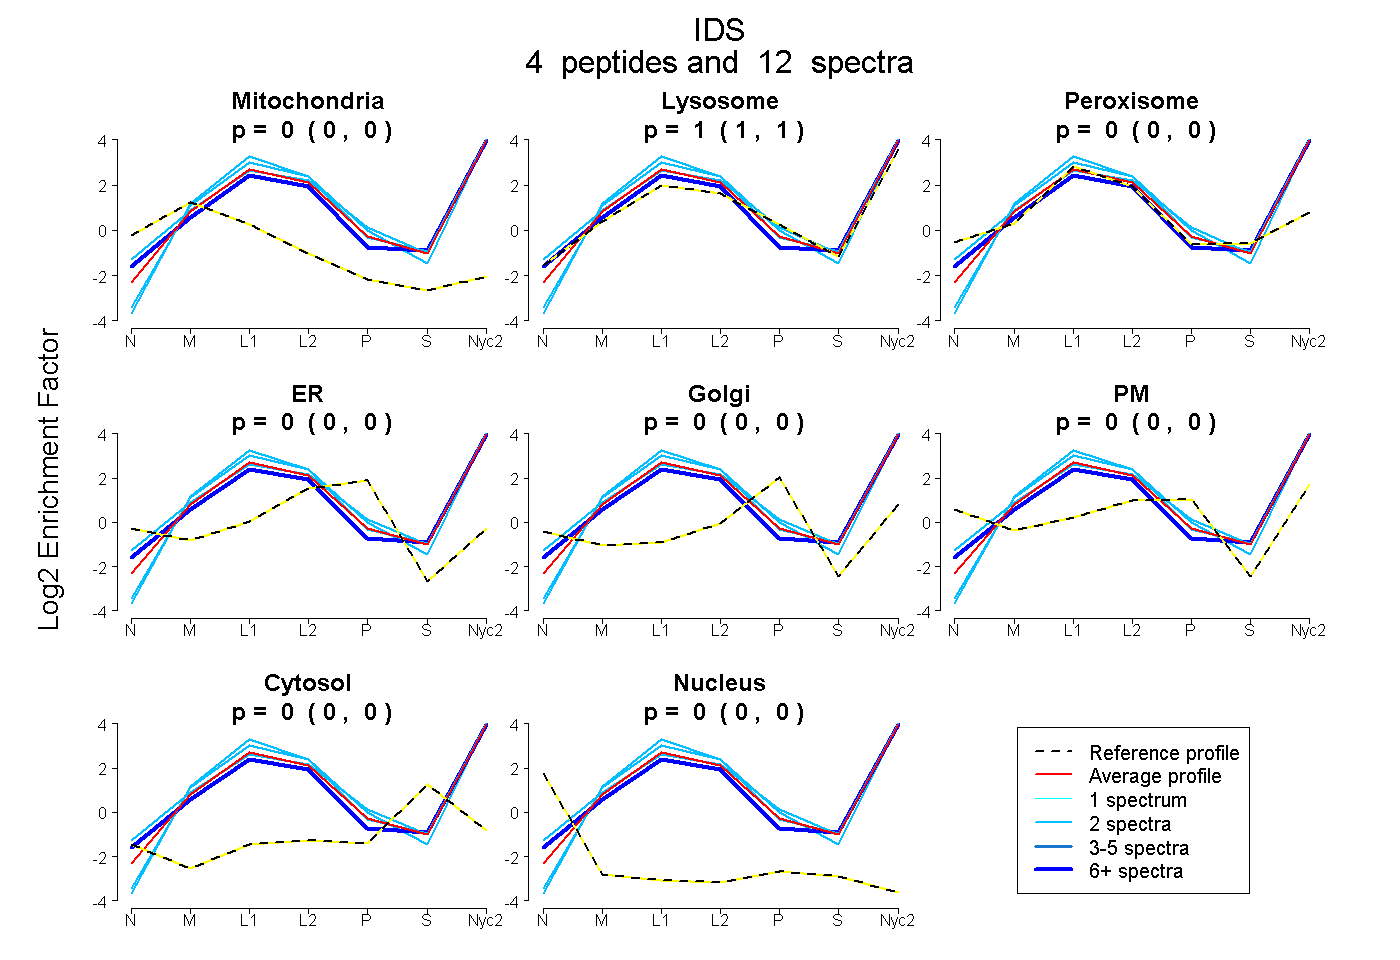 |
0.000
0.000 | 0.000 |
1.000
1.000 | 1.000 |
|
0.000
0.000 | 0.000 |
0.000
0.000 | 0.000 |
0.000
0.000 | 0.000 |
0.000
0.000 | 0.000 |
0.000
0.000 | 0.000 |
0.000
0.000 | 0.000 |
|
| | | Plot |
Mito |
|
Lyso or Perox |
|
ER |
Golgi |
PM |
Cytosol |
Nucleus |
|
| Expt B |
2
peptides |
3
spectra |
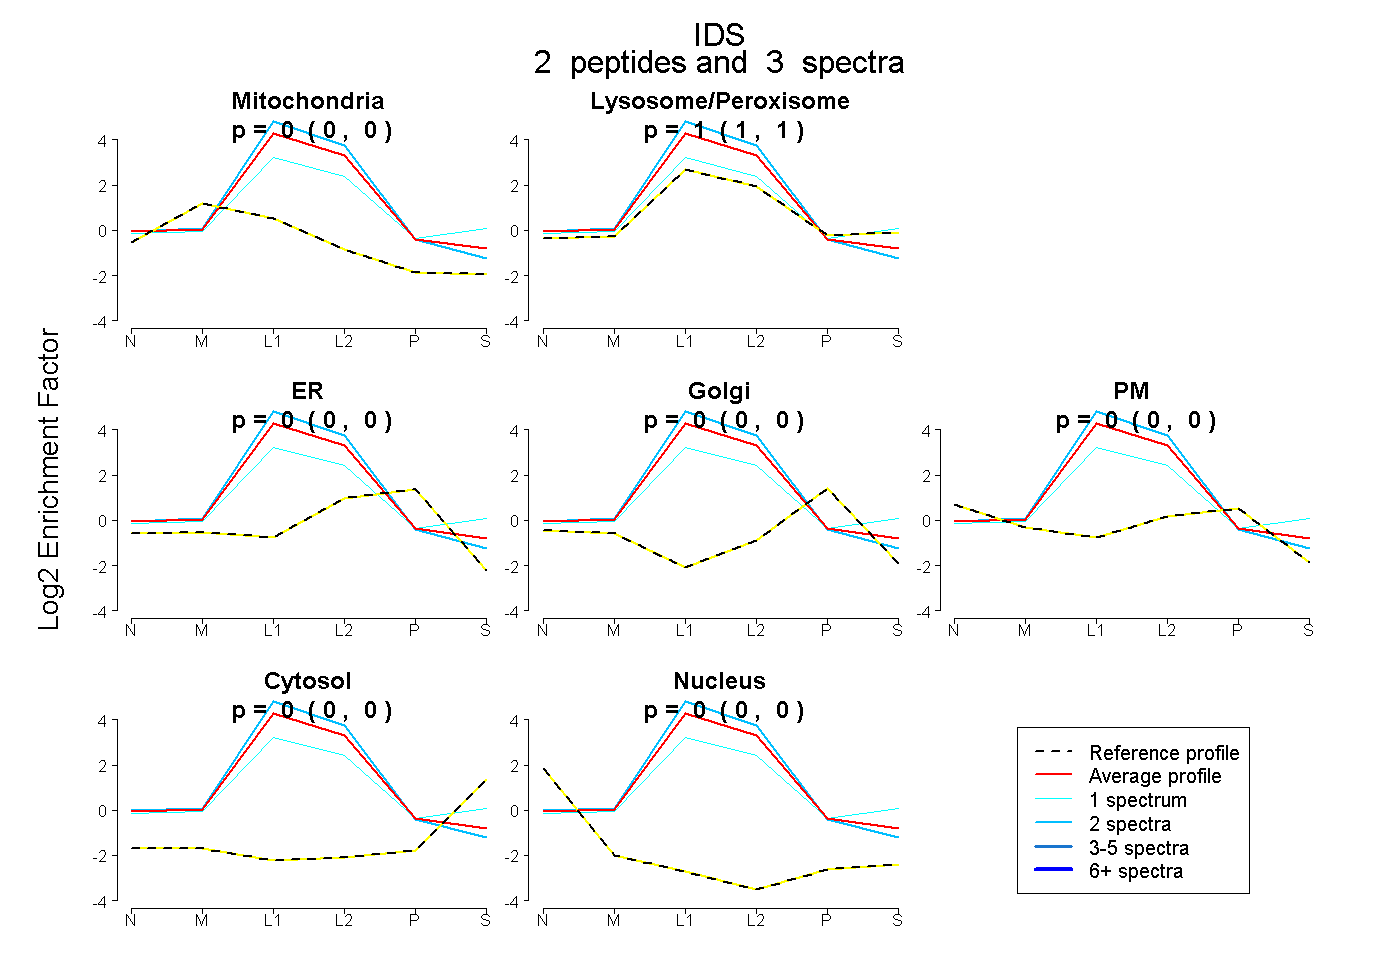 |
0.000
0.000 | 0.000 |
|
1.000
1.000 | 1.000 |
|
0.000
0.000 | 0.000 |
0.000
0.000 | 0.000 |
0.000
0.000 | 0.000 |
0.000
0.000 | 0.000 |
0.000
0.000 | 0.000 |
|
| | | Plot |
|
Lyso |
|
|
|
|
|
|
|
Other |
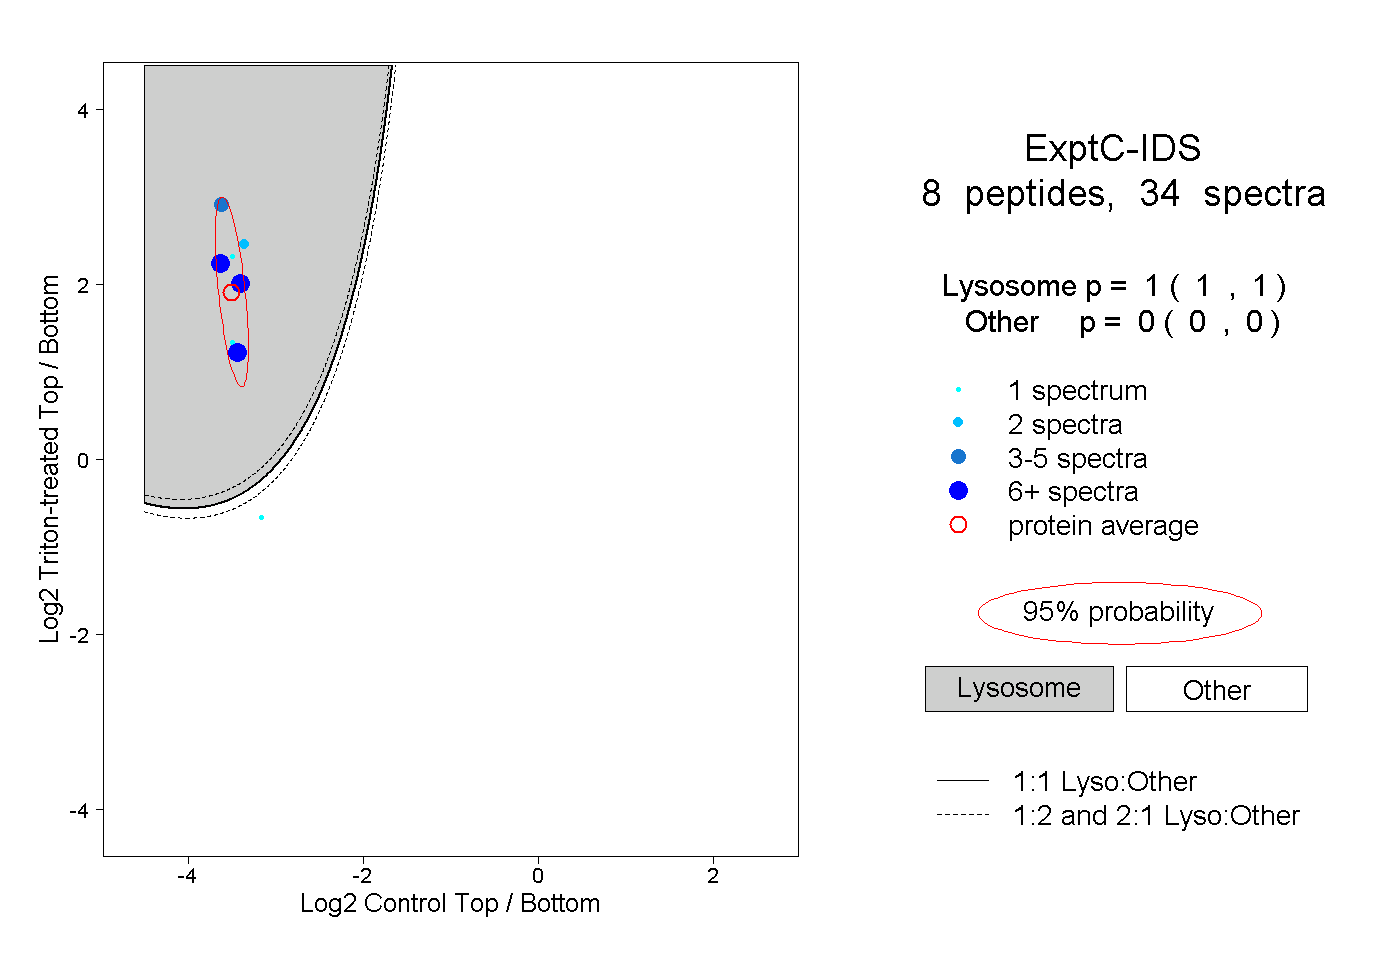
| Expt C |
8
peptides |
34
spectra |
 |
|
1.000
1.000 | 1.000 |
|
|
|
|
|
|
|
0.000
0.000 | 0.000 |
| 1 spectrum, LYDFNSYWR |
|
1.000 |
|
|
|
|
|
|
|
0.000 |
| 1 spectrum, VMGYSIR |
|
0.013 |
|
|
|
|
|
|
|
0.987 |
| 6 spectra, QSTEEAIR |
|
1.000 |
|
|
|
|
|
|
|
0.000 |
| 4 spectra, RPDTTR |
|
1.000 |
|
|
|
|
|
|
|
0.000 |
| 1 spectrum, ENGYVTMSVGK |
|
1.000 |
|
|
|
|
|
|
|
0.000 |
| 9 spectra, YSNFDVTTR |
|
1.000 |
|
|
|
|
|
|
|
0.000 |
| 2 spectra, VPLMFYVPGK |
|
1.000 |
|
|
|
|
|
|
|
0.000 |
| 10 spectra, VSFLTGR |
|
1.000 |
|
|
|
|
|
|
|
0.000 |
| | | Plot |
|
Lyso |
|
|
|
|
|
|
|
Other |
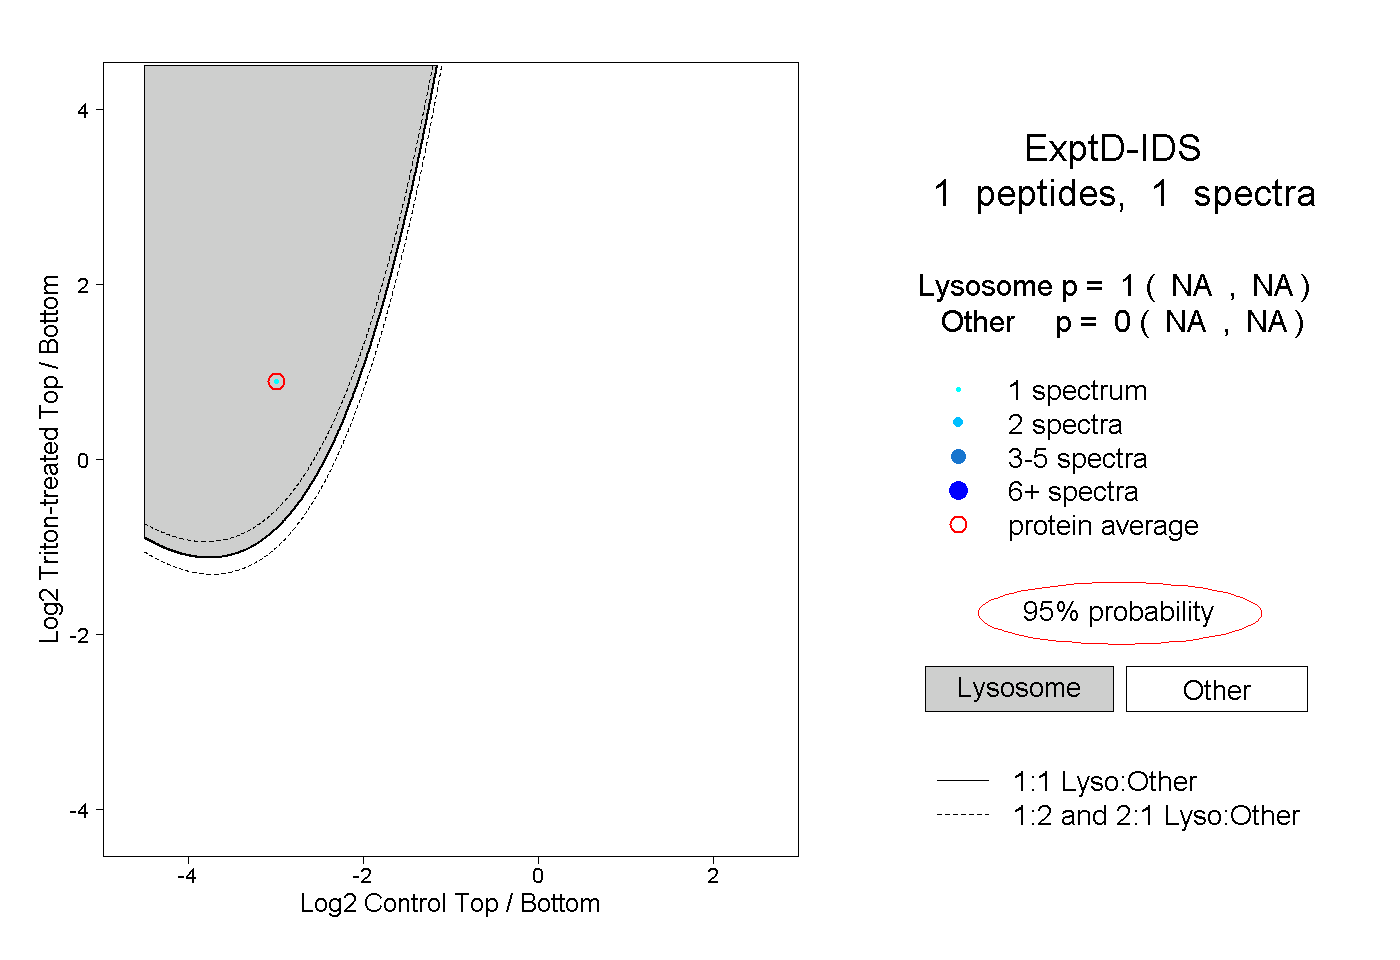
| Expt D |
1
peptide |
1
spectrum |
 |
|
1.000
NA | NA |
|
|
|
|
|
|
|
0.000
NA | NA |