EXOC2
[ENSRNOP00000050367]
Main page
| | | Plot |
Mito |
Lyso |
|
Perox |
ER |
Golgi |
PM |
Cytosol |
Nucleus |
|
| Expt A |
 13
13
peptides |
29
spectra |
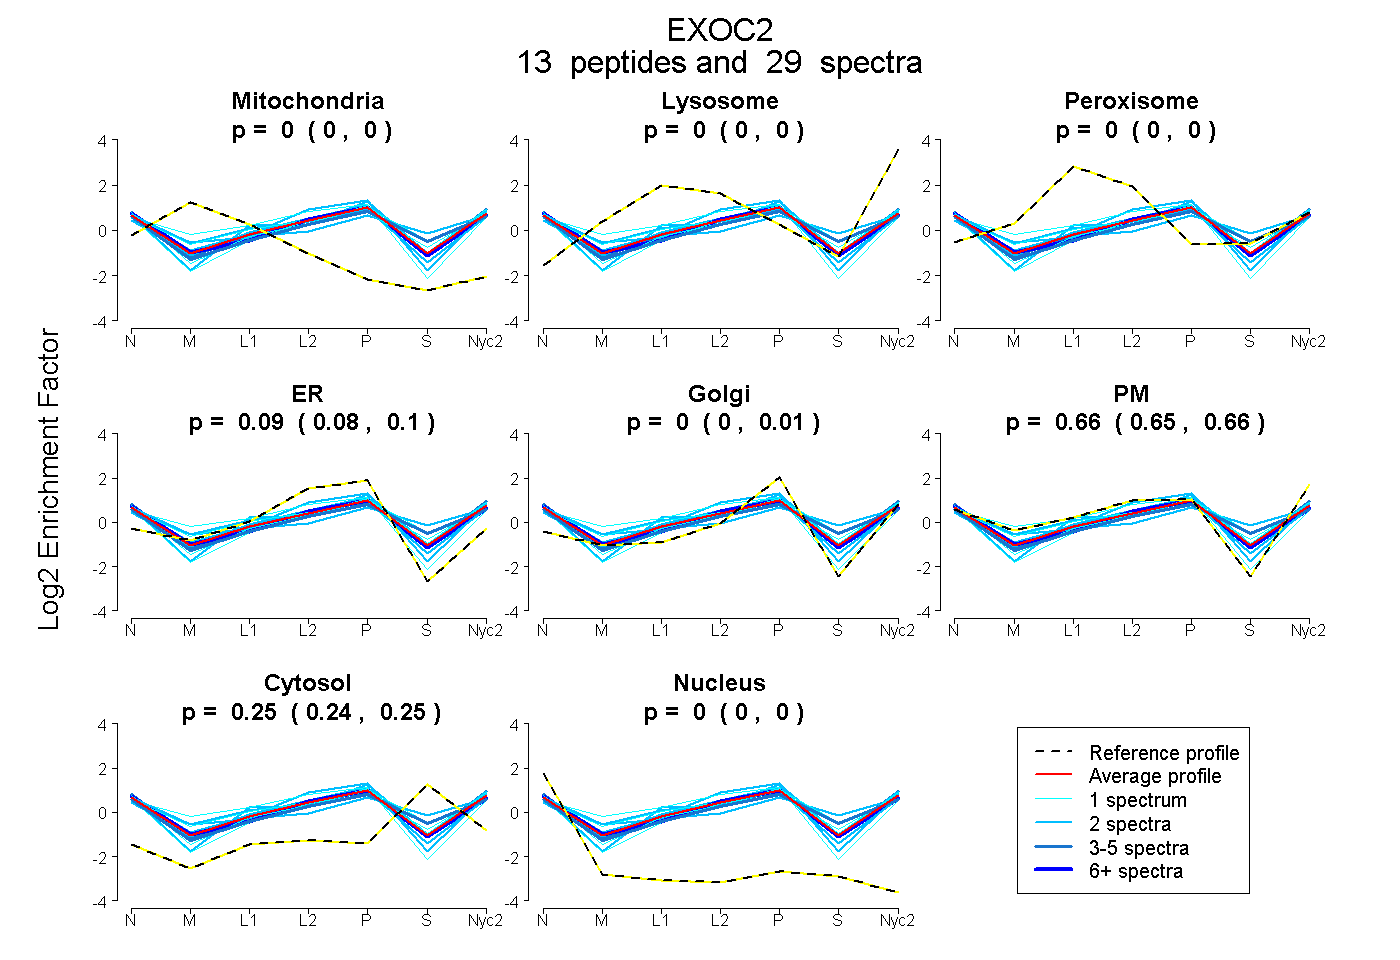 |
0.000
0.000 | 0.000 |
0.000
0.000 | 0.000 |
|
0.000
0.000 | 0.000 |
0.094
0.084 | 0.100 |
0.003
0.000 | 0.015 |
0.656
0.647 | 0.663 |
0.247
0.240 | 0.252 |
0.000
0.000 | 0.000 |
|
| | | Plot |
Mito |
|
Lyso or Perox |
|
ER |
Golgi |
PM |
Cytosol |
Nucleus |
|
| Expt B |
6
peptides |
9
spectra |
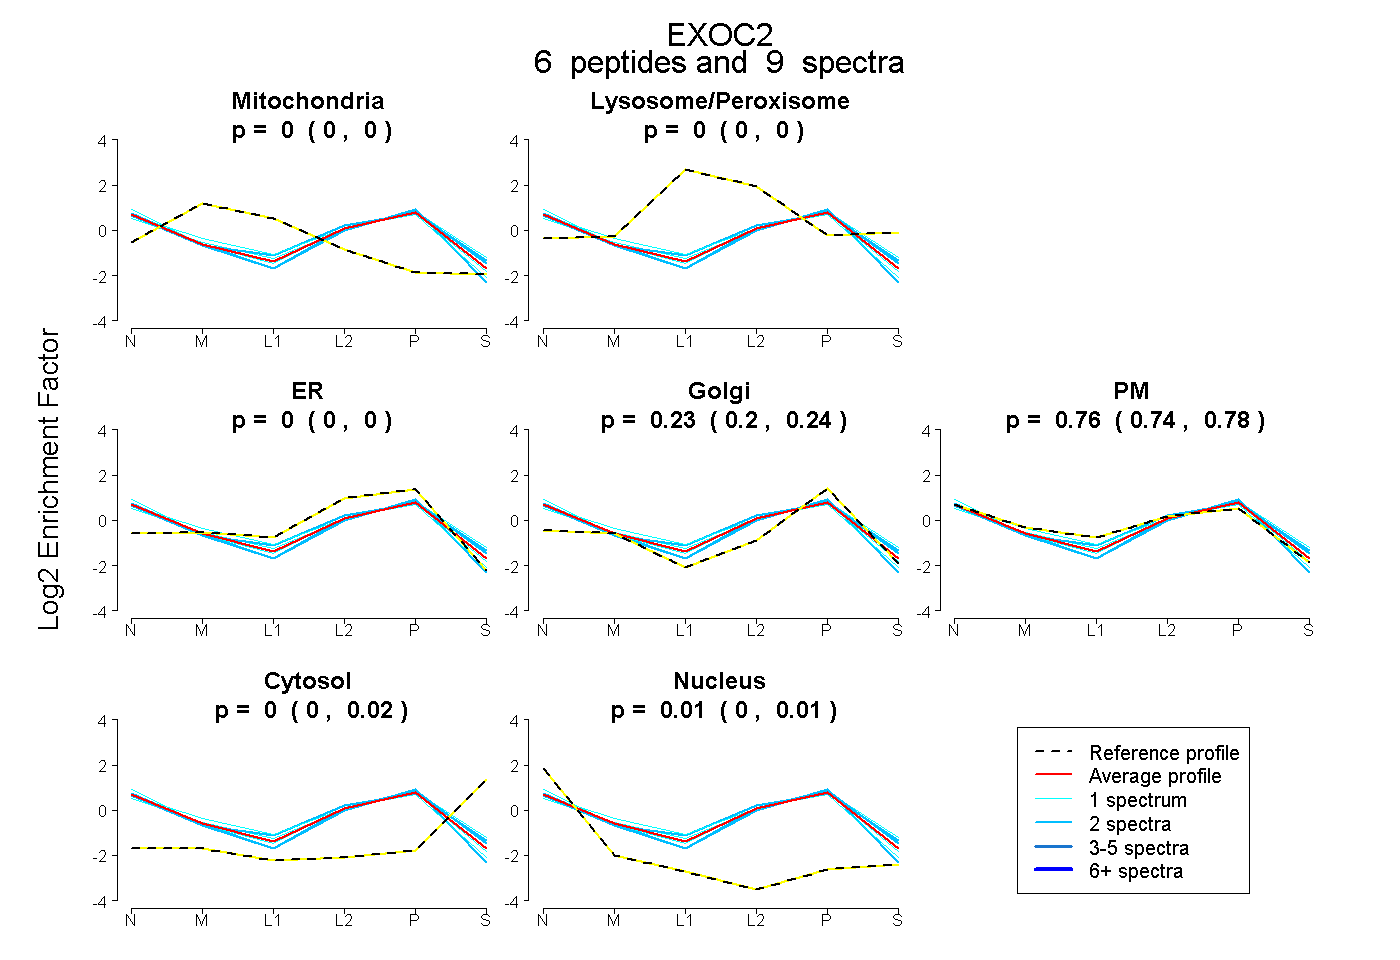 |
0.000
0.000 | 0.000 |
|
0.000
0.000 | 0.000 |
|
0.000
0.000 | 0.000 |
0.229
0.200 | 0.245 |
0.761
0.738 | 0.781 |
0.000
0.000 | 0.017 |
0.010
0.000 | 0.014 |
|
| 2 spectra, VIEAVSEELSR |
0.000 |
|
0.000 |
|
0.000 |
0.303 |
0.661 |
0.036 |
0.000 |
|
| 1 spectrum, NALNVLQR |
0.000 |
|
0.000 |
|
0.000 |
0.145 |
0.855 |
0.000 |
0.000 |
|
| 1 spectrum, LFENYIELK |
0.000 |
|
0.020 |
|
0.000 |
0.199 |
0.713 |
0.067 |
0.000 |
|
| 2 spectra, GALLPFSLR |
0.000 |
|
0.000 |
|
0.060 |
0.306 |
0.588 |
0.000 |
0.047 |
|
| 1 spectrum, LENVLNR |
0.000 |
|
0.000 |
|
0.002 |
0.157 |
0.799 |
0.000 |
0.041 |
|
| 2 spectra, LLEELLNK |
0.000 |
|
0.000 |
|
0.044 |
0.047 |
0.846 |
0.063 |
0.000 |
|
| | | Plot |
|
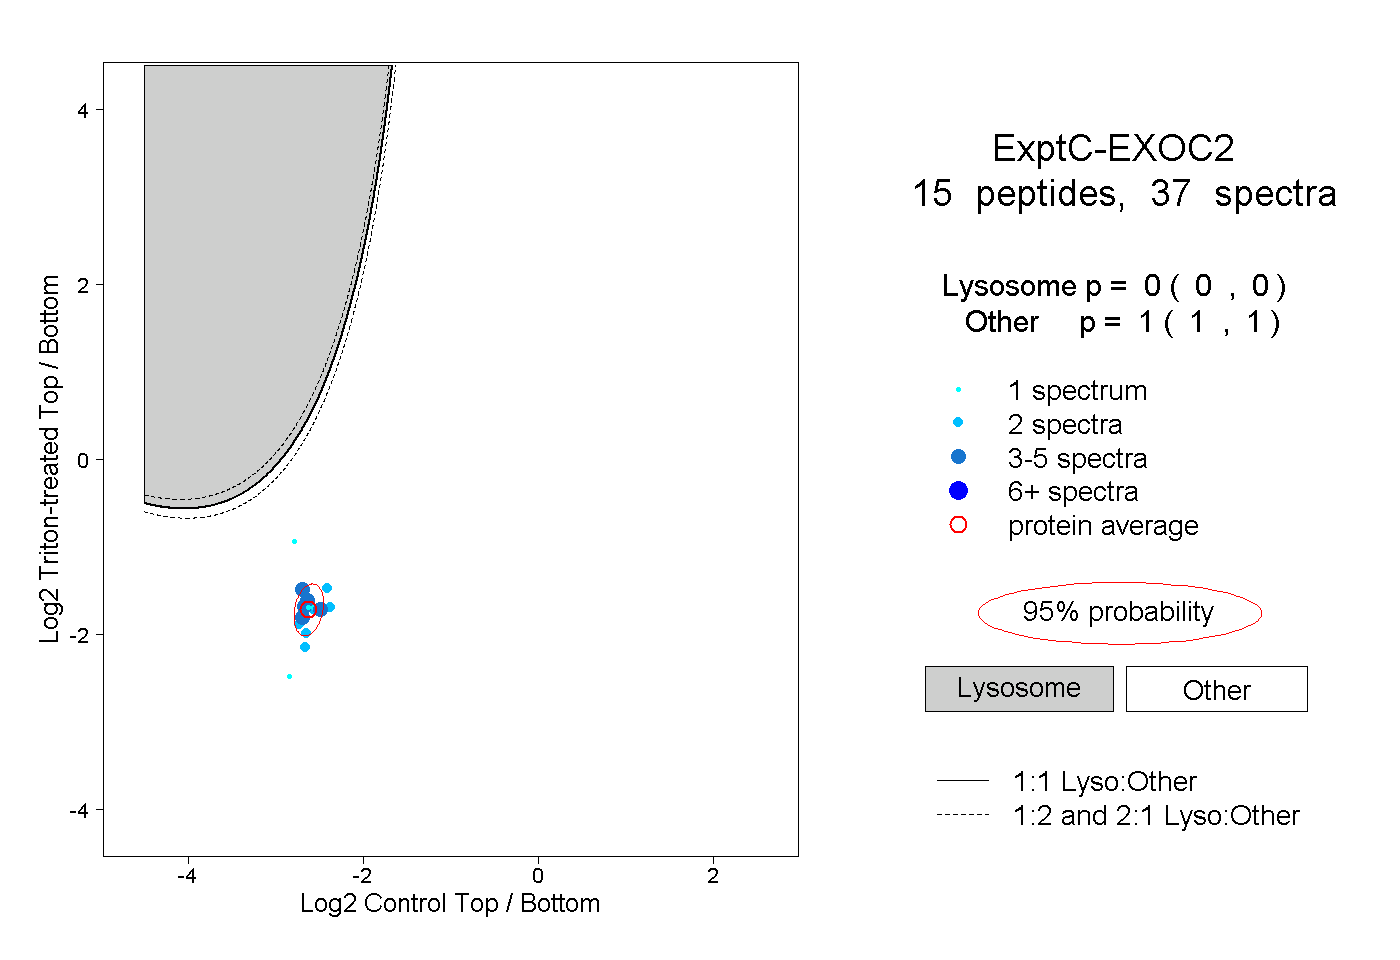
Lyso |
|
|
|
|
|
|
|
Other |
| Expt C |
15
peptides |
37
spectra |
 |
|
0.000
0.000 | 0.000 |
|
|
|
|
|
|
|
1.000
1.000 | 1.000 |
| | | Plot |
|
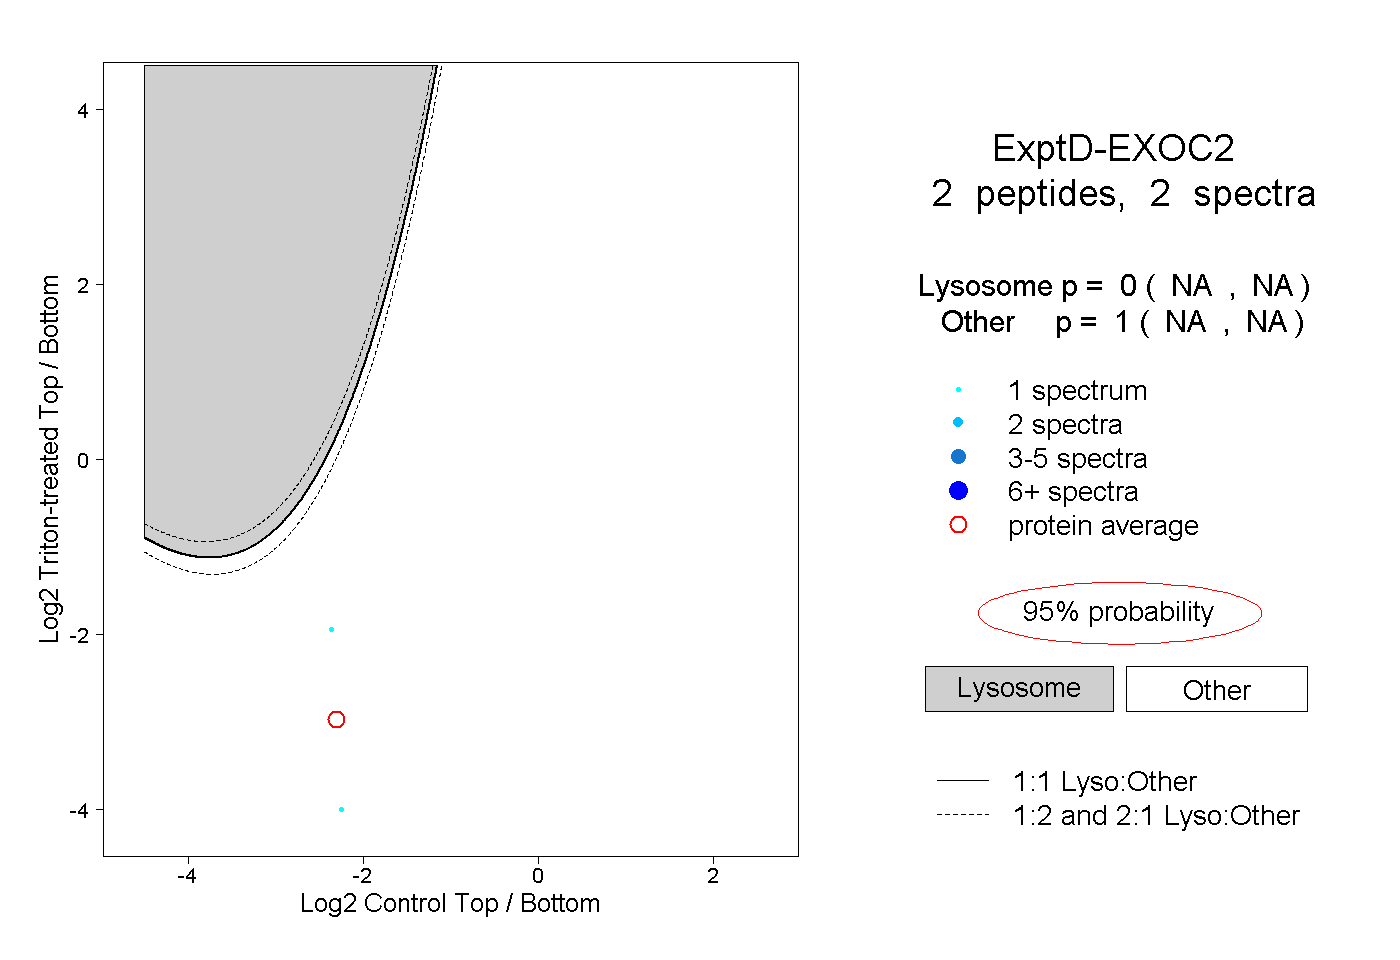
Lyso |
|
|
|
|
|
|
|
Other |
| Expt D |
2
peptides |
2
spectra |
 |
|
0.000
NA | NA |
|
|
|
|
|
|
|
1.000
NA | NA |