 13
13peptides
spectra
0.000 | 0.000
0.000 | 0.000
0.000 | 0.000
0.084 | 0.100
0.000 | 0.015
0.647 | 0.663
0.240 | 0.252
0.000 | 0.000
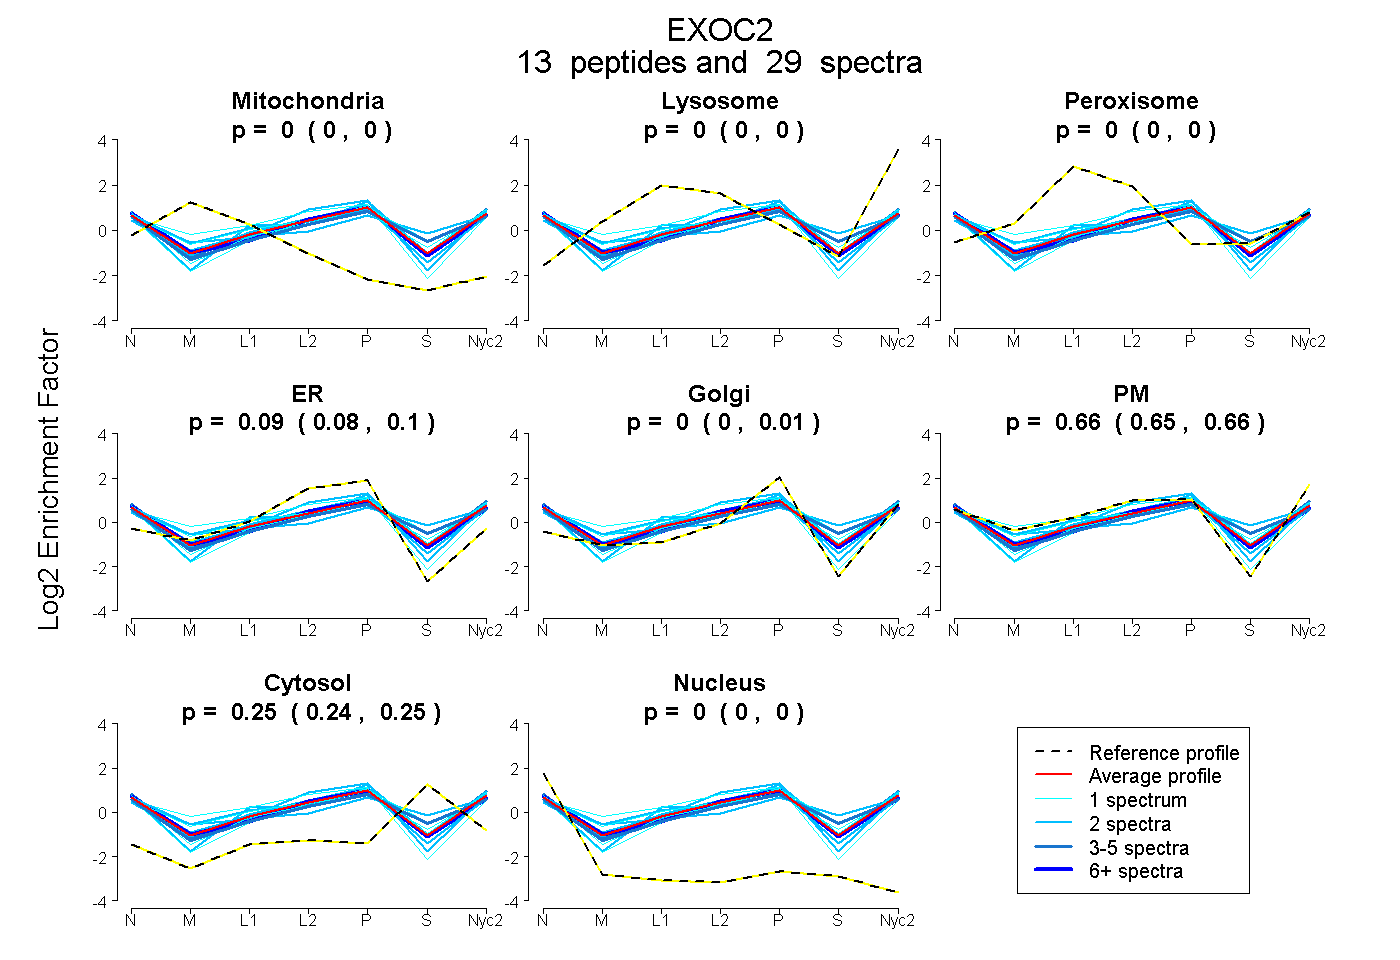
| Plot | Mito | Lyso | Perox | ER | Golgi | PM | Cytosol | Nucleus | |||||
| Expt A |
13 peptides |
29 spectra |
|
0.000 0.000 | 0.000 |
0.000 0.000 | 0.000 |
0.000 0.000 | 0.000 |
0.094 0.084 | 0.100 |
0.003 0.000 | 0.015 |
0.656 0.647 | 0.663 |
0.247 0.240 | 0.252 |
0.000 0.000 | 0.000 |
| 1 spectrum, SEGSLAYVK | 0.000 | 0.000 | 0.084 | 0.009 | 0.000 | 0.656 | 0.251 | 0.000 | ||
| 1 spectrum, VAFVEK | 0.000 | 0.000 | 0.000 | 0.121 | 0.035 | 0.490 | 0.354 | 0.000 | ||
| 2 spectra, HTFLNIAEHFEK | 0.000 | 0.000 | 0.000 | 0.000 | 0.074 | 0.710 | 0.216 | 0.000 | ||
| 2 spectra, DTVAIYLTPESR | 0.000 | 0.000 | 0.018 | 0.000 | 0.000 | 0.587 | 0.394 | 0.000 | ||
| 1 spectrum, LVLSQLPNFWK | 0.000 | 0.000 | 0.000 | 0.000 | 0.104 | 0.642 | 0.255 | 0.000 | ||
| 1 spectrum, LENVLNR | 0.072 | 0.000 | 0.052 | 0.269 | 0.025 | 0.557 | 0.000 | 0.025 | ||
| 3 spectra, VIEAVSEELSR | 0.000 | 0.000 | 0.000 | 0.051 | 0.003 | 0.597 | 0.350 | 0.000 | ||
| 2 spectra, GDYDVVINDYEK | 0.000 | 0.000 | 0.000 | 0.127 | 0.000 | 0.652 | 0.221 | 0.000 | ||
| 2 spectra, GTSTVSFK | 0.000 | 0.000 | 0.000 | 0.242 | 0.022 | 0.623 | 0.102 | 0.011 | ||
| 2 spectra, LMQCVSSFSR | 0.000 | 0.000 | 0.109 | 0.060 | 0.110 | 0.563 | 0.106 | 0.052 | ||
| 2 spectra, GSSFQSGR | 0.000 | 0.000 | 0.000 | 0.051 | 0.092 | 0.617 | 0.241 | 0.000 | ||
| 6 spectra, LLEELLNK | 0.000 | 0.000 | 0.000 | 0.109 | 0.032 | 0.615 | 0.226 | 0.019 | ||
| 4 spectra, GALLPFSLR | 0.000 | 0.000 | 0.000 | 0.003 | 0.018 | 0.733 | 0.241 | 0.005 |
| Plot | Mito | Lyso or Perox | ER | Golgi | PM | Cytosol | Nucleus | ||||||
| Expt B |
6 peptides |
9 spectra |
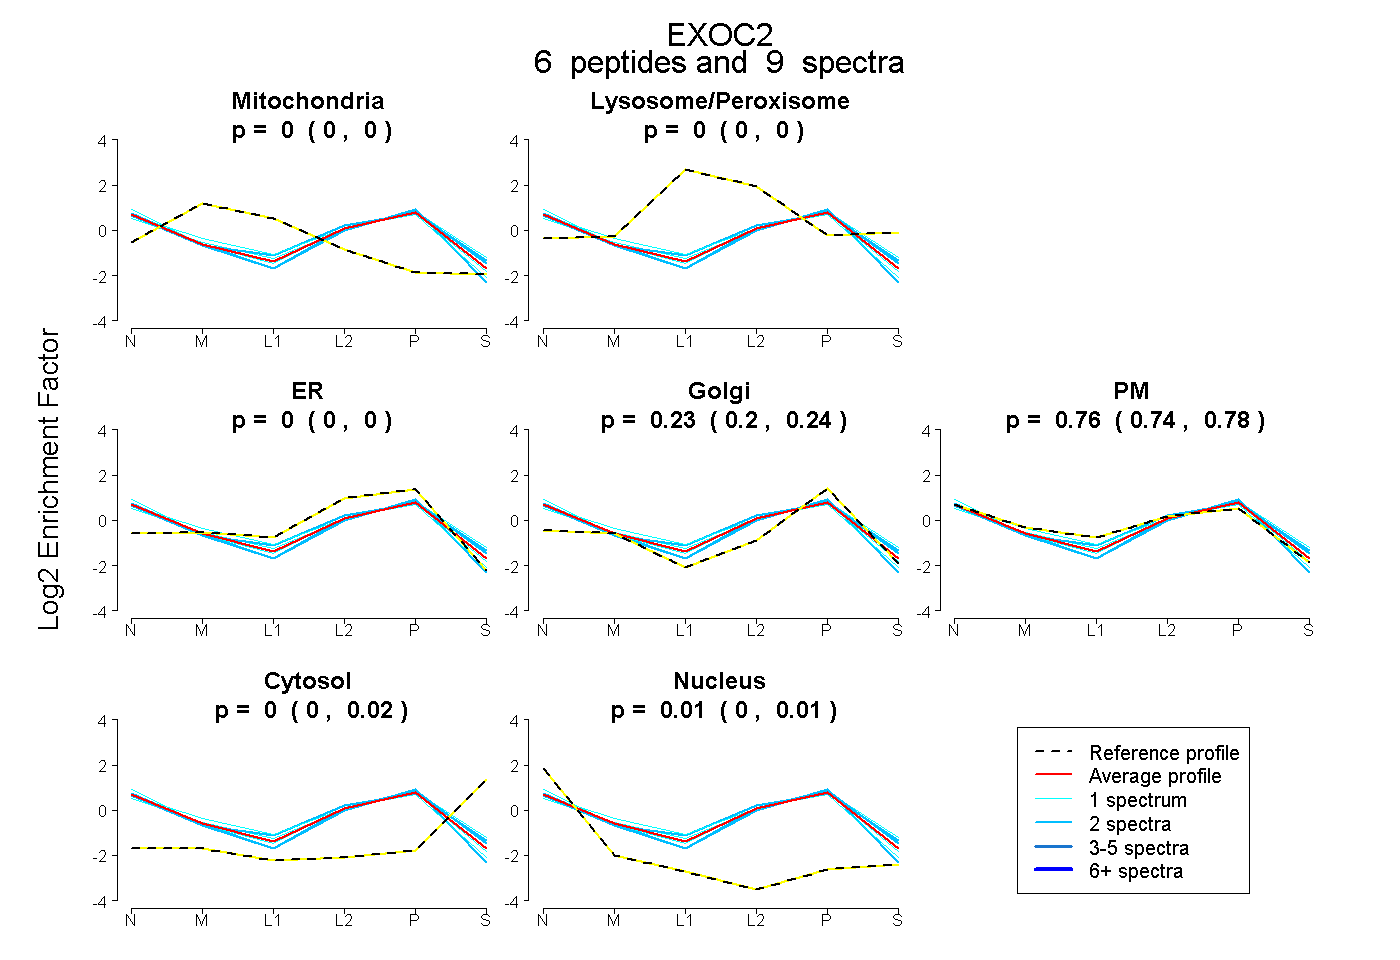 |
0.000 0.000 | 0.000 |
0.000 0.000 | 0.000 |
0.000 0.000 | 0.000 |
0.229 0.200 | 0.245 |
0.761 0.738 | 0.781 |
0.000 0.000 | 0.017 |
0.010 0.000 | 0.014 |
|||
| Plot | Lyso | Other | |||||||||||
| Expt C |
15 peptides |
37 spectra |
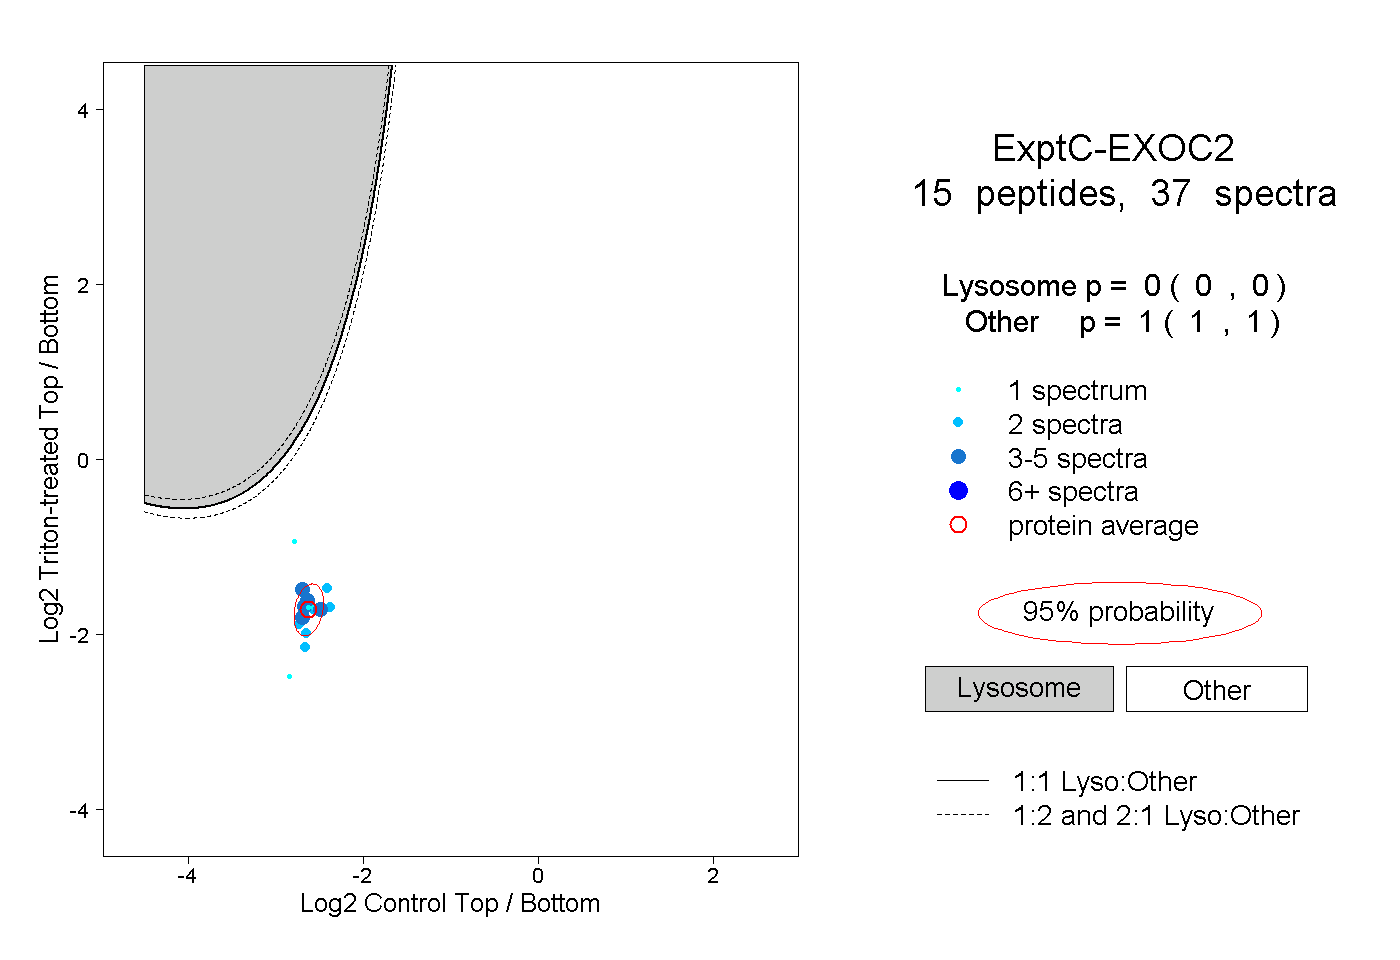 |
0.000 0.000 | 0.000 |
1.000 1.000 | 1.000 |
||||||||
| Plot | Lyso | Other | |||||||||||
| Expt D |
2 peptides |
2 spectra |
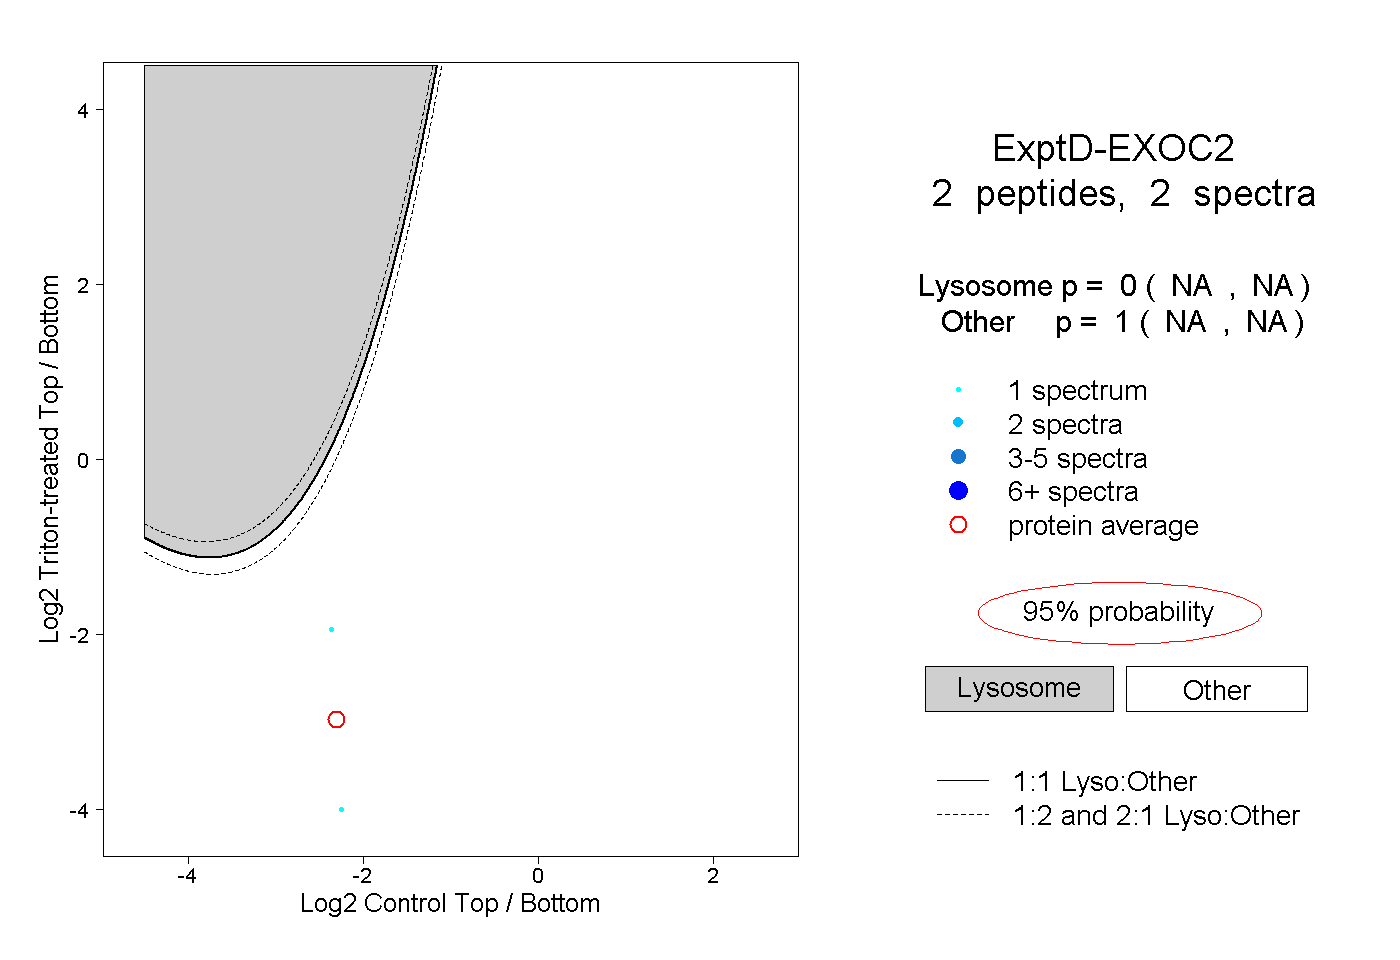 |
0.000 NA | NA |
1.000 NA | NA |