 4
4peptides
spectra
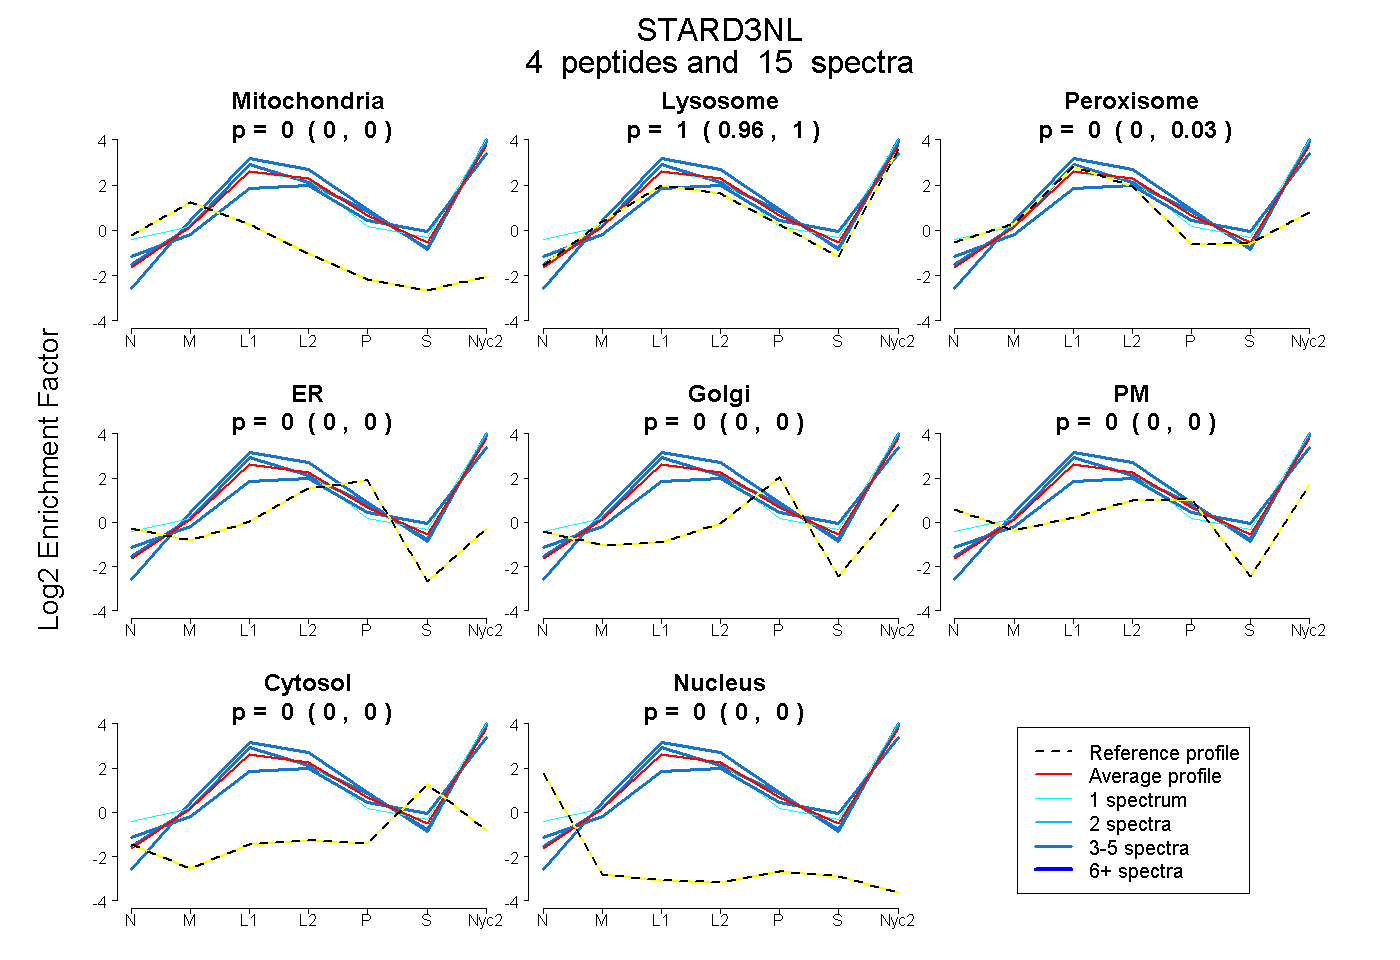
0.000 | 0.000
0.958 | 1.000
0.000 | 0.035
0.000 | 0.000
0.000 | 0.000
0.000 | 0.000
0.000 | 0.000
0.000 | 0.000
2peptides
spectra
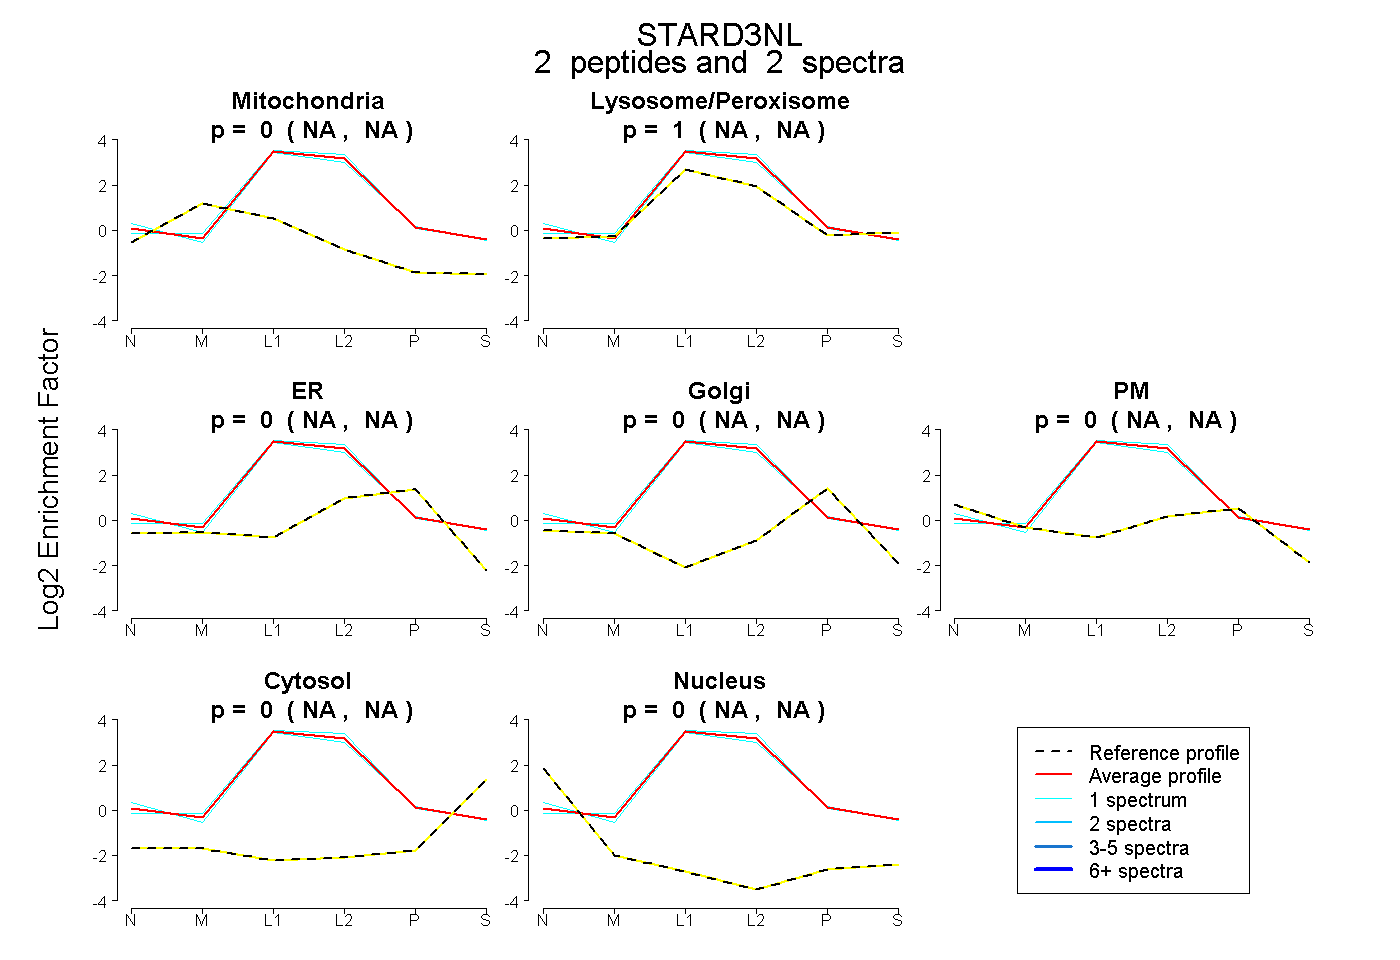
NA | NA
NA | NA
NA | NA
NA | NA
NA | NA
NA | NA
NA | NA
5peptides
spectra
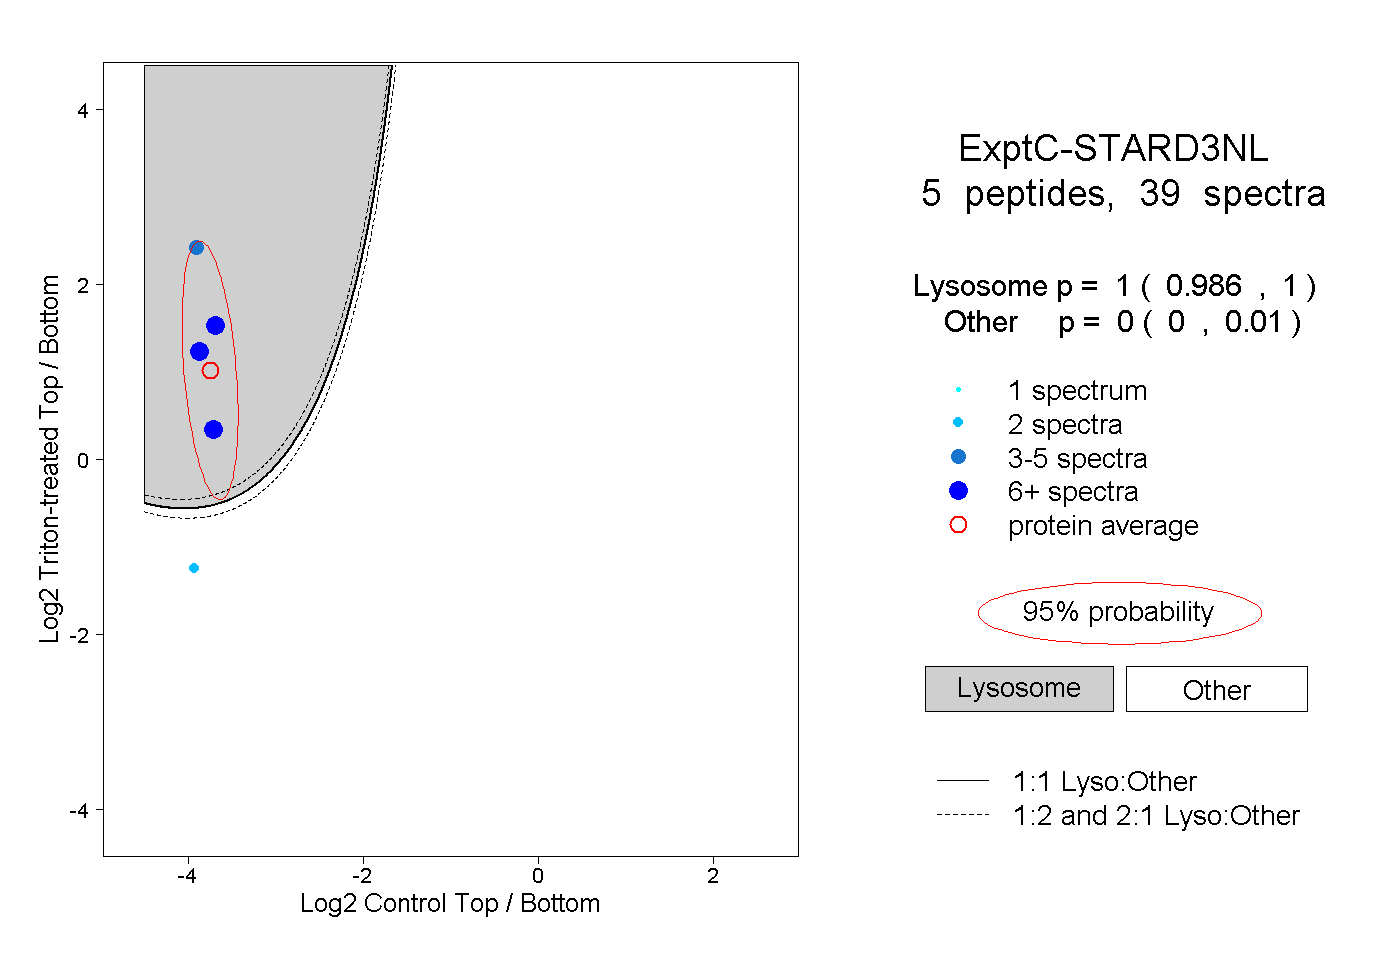
0.986 | 1.000
0.000 | 0.010
3peptides
spectra
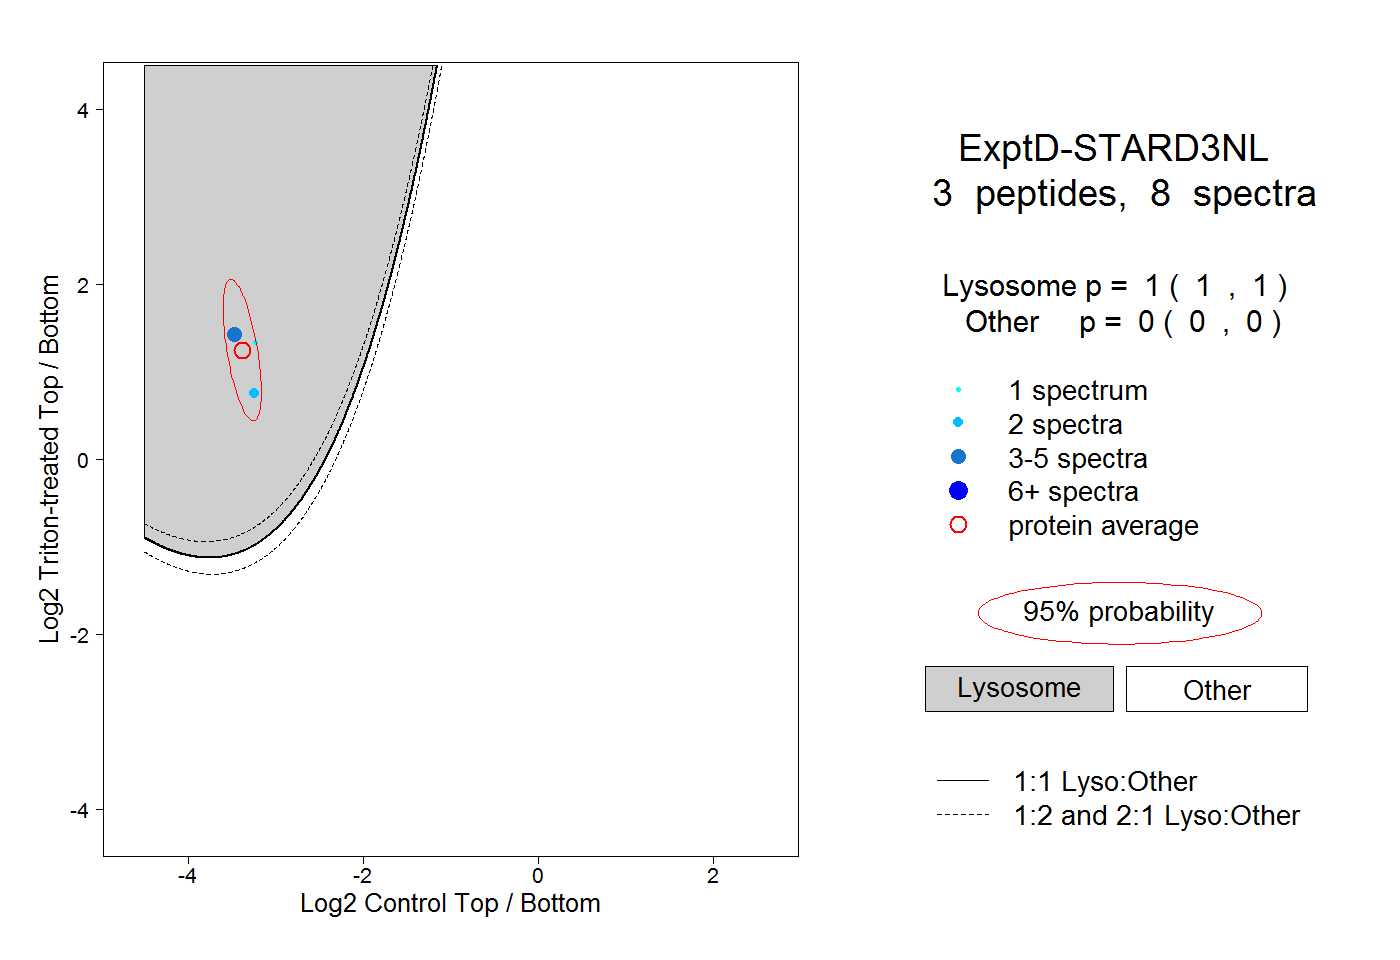
1.000 | 1.000
0.000 | 0.000