 15
15peptides
spectra
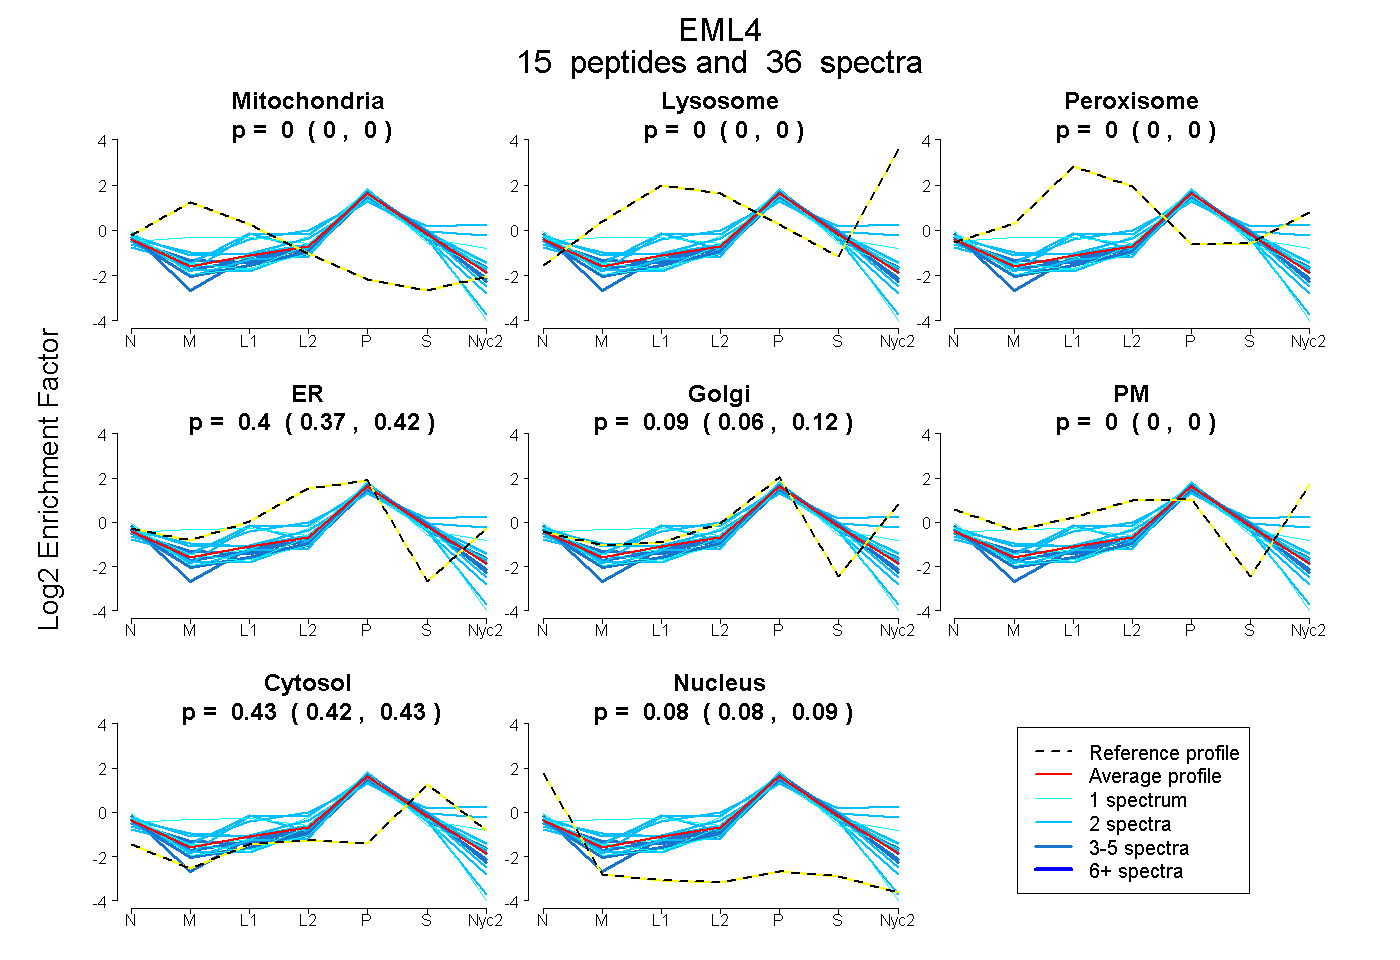
0.000 | 0.000
0.000 | 0.000
0.000 | 0.000
0.367 | 0.418
0.063 | 0.122
0.000 | 0.000
0.422 | 0.429
0.077 | 0.091
7peptides
spectra
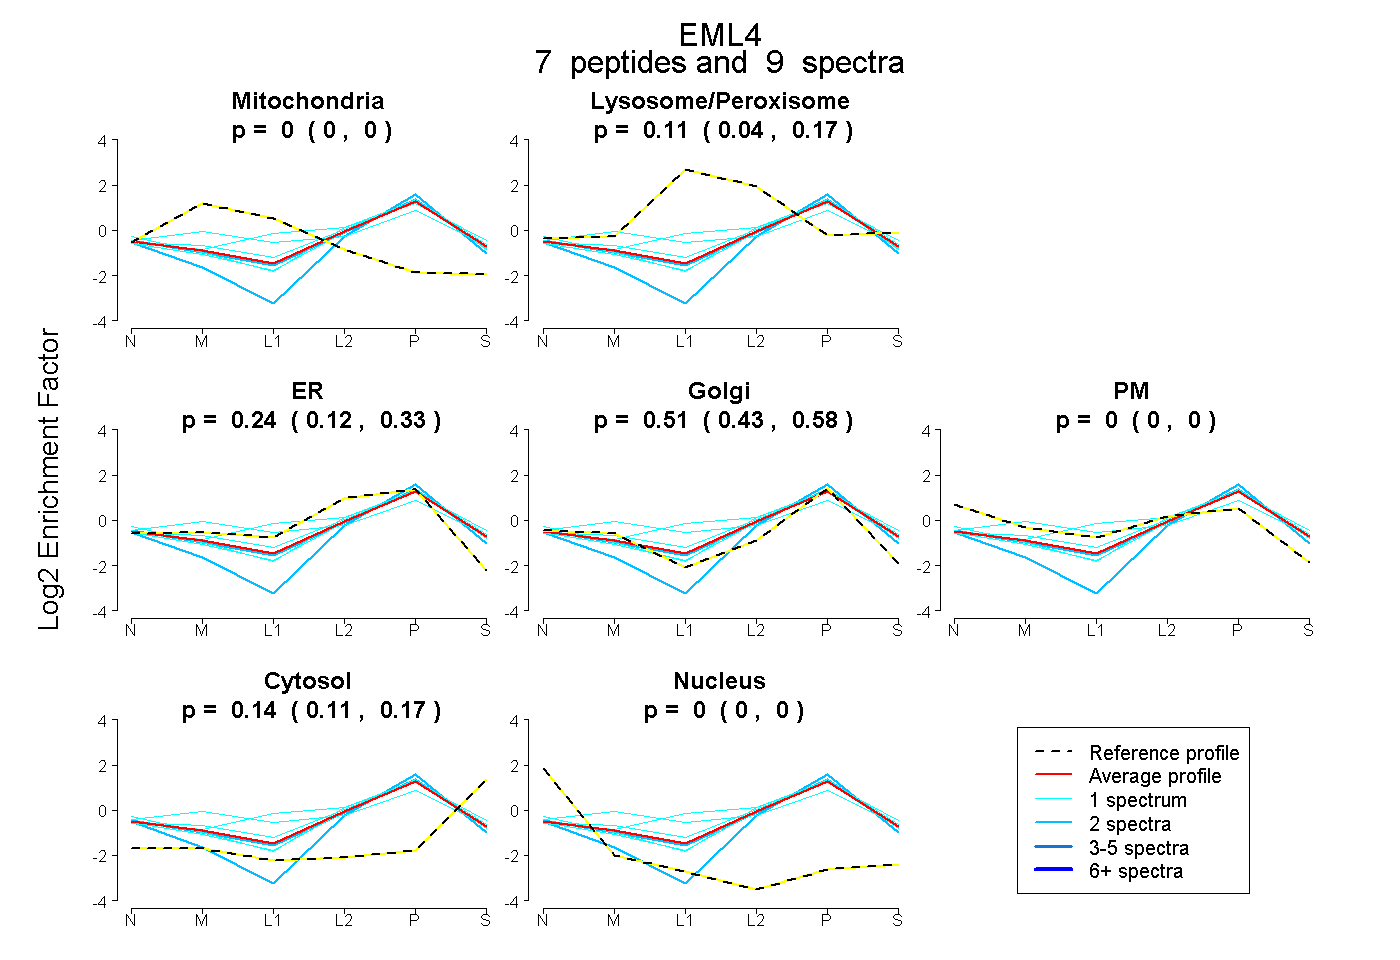
0.000 | 0.000
0.041 | 0.166
0.124 | 0.330
0.431 | 0.577
0.000 | 0.000
0.110 | 0.173
0.000 | 0.000
13peptides
spectra
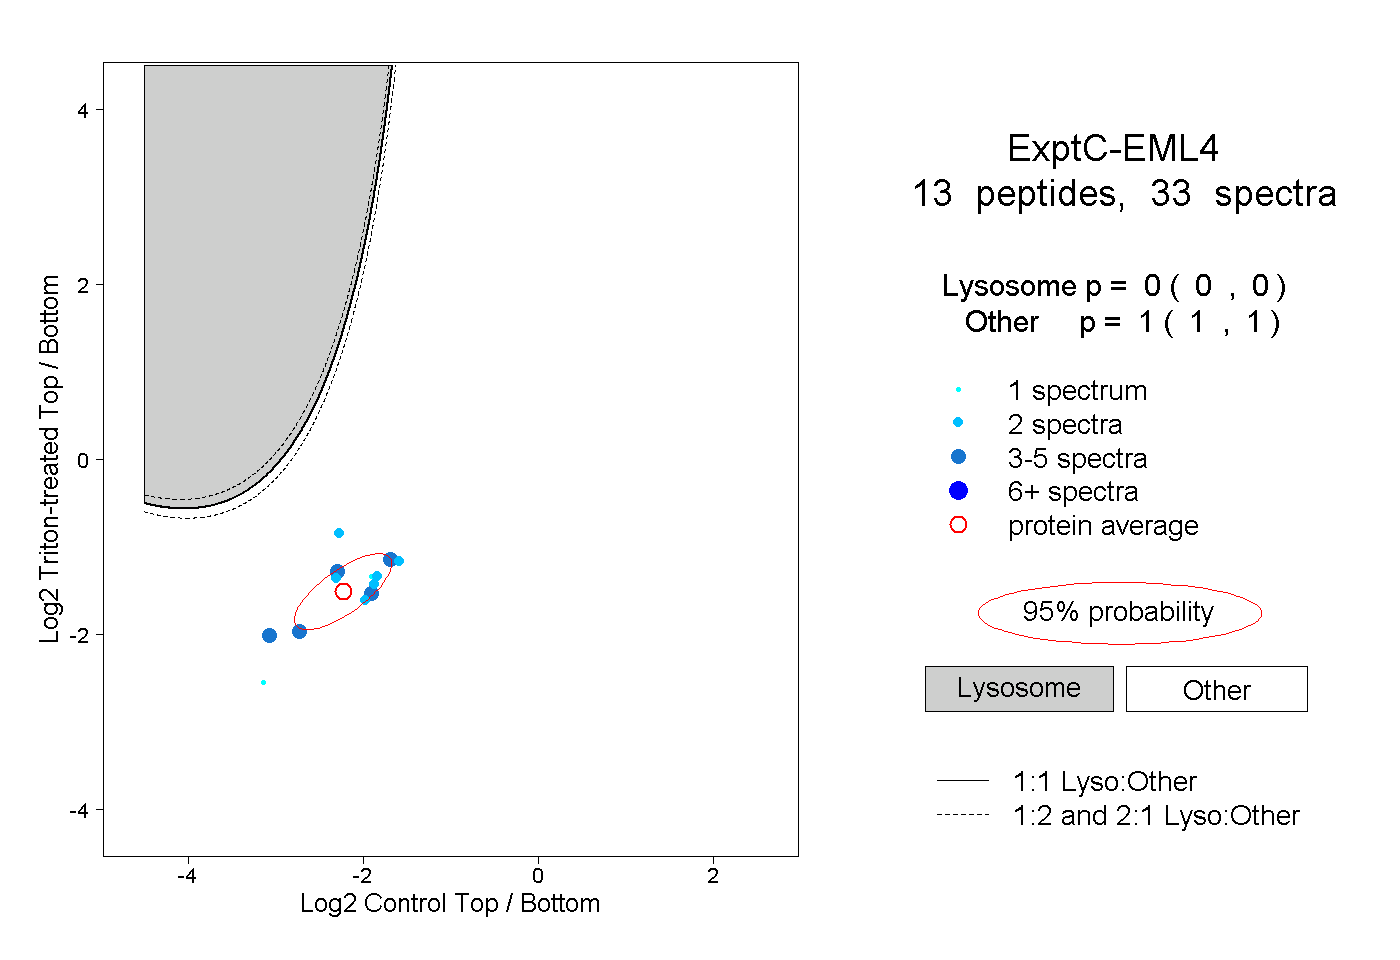
0.000 | 0.000
1.000 | 1.000
5peptides
spectra
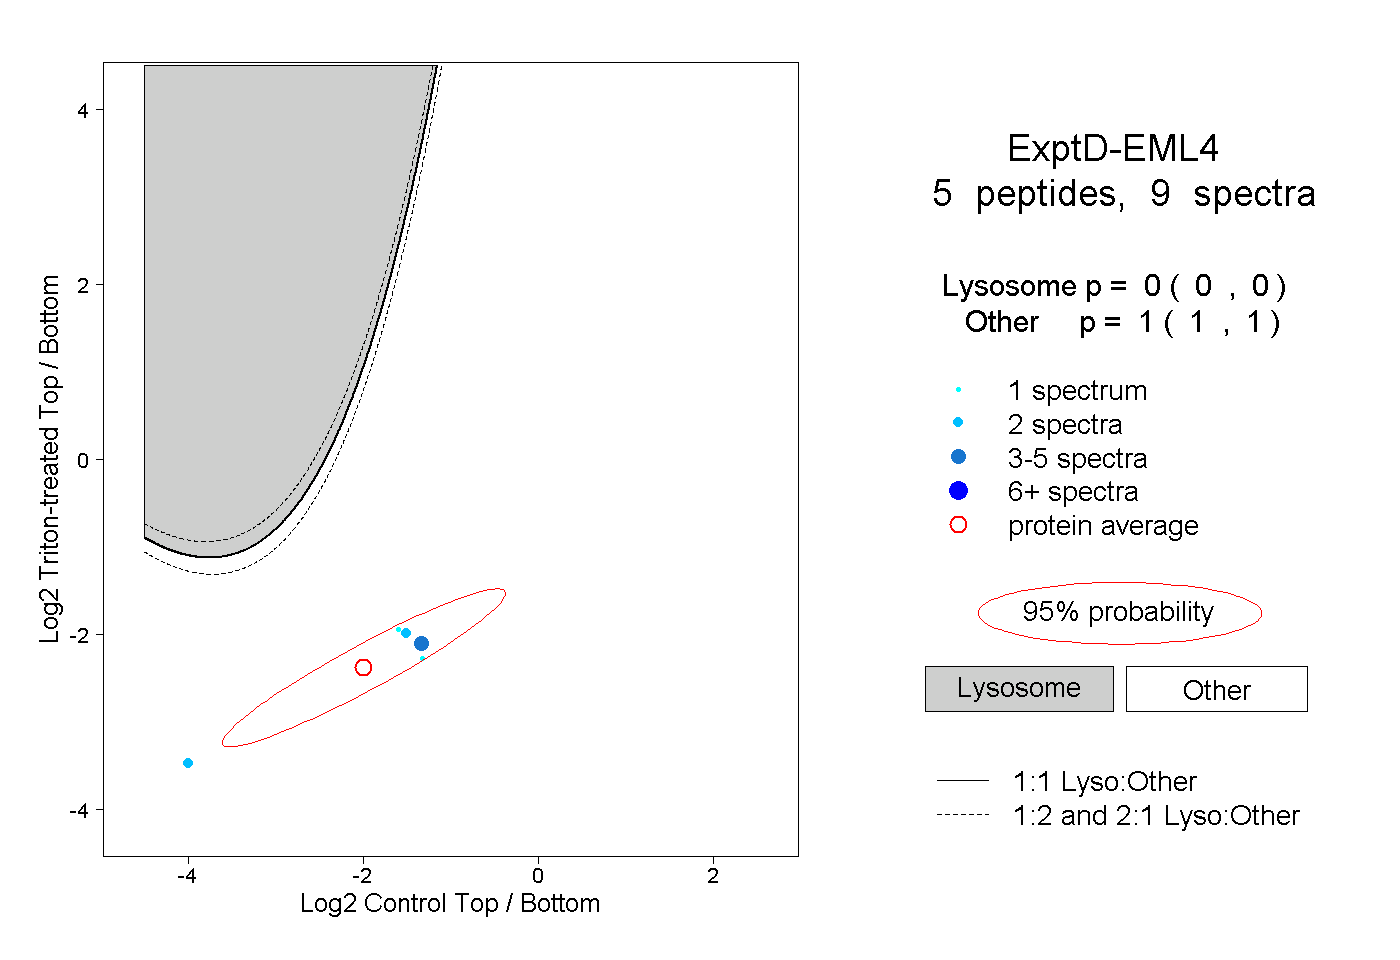
0.000 | 0.000
1.000 | 1.000