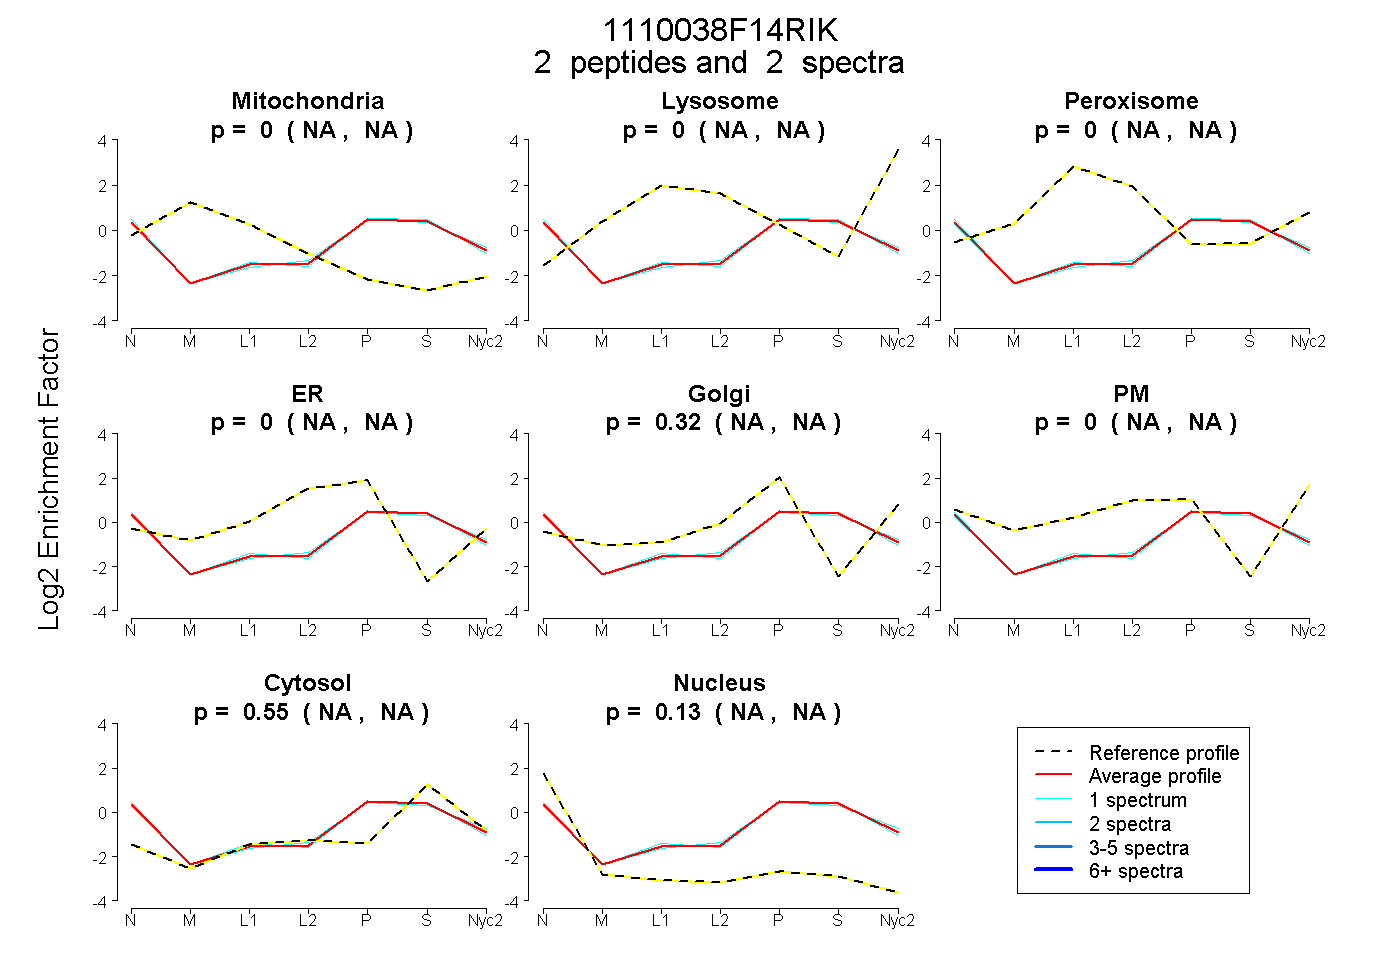
 2
2peptides
spectra
NA | NA
NA | NA
NA | NA
NA | NA
NA | NA
NA | NA
NA | NA
NA | NA
| Plot | Mito | Lyso | Perox | ER | Golgi | PM | Cytosol | Nucleus | |||||
| Expt A |
2 peptides |
2 spectra |
|
0.000 NA | NA |
0.000 NA | NA |
0.000 NA | NA |
0.000 NA | NA |
0.318 NA | NA |
0.000 NA | NA |
0.552 NA | NA |
0.130 NA | NA |
| 1 spectrum, SAQVQLVGEAAR | 0.000 | 0.000 | 0.000 | 0.000 | 0.335 | 0.000 | 0.533 | 0.132 | ||
| 1 spectrum, AGTMSDLTNEEFR | 0.000 | 0.000 | 0.000 | 0.000 | 0.300 | 0.000 | 0.572 | 0.128 |