 7
7peptides
spectra
0.000 | 0.000
0.016 | 0.029
0.006 | 0.022
0.044 | 0.058
0.000 | 0.000
0.902 | 0.919
0.000 | 0.000
0.000 | 0.000
| Plot | Mito | Lyso | Perox | ER | Golgi | PM | Cytosol | Nucleus | |||||
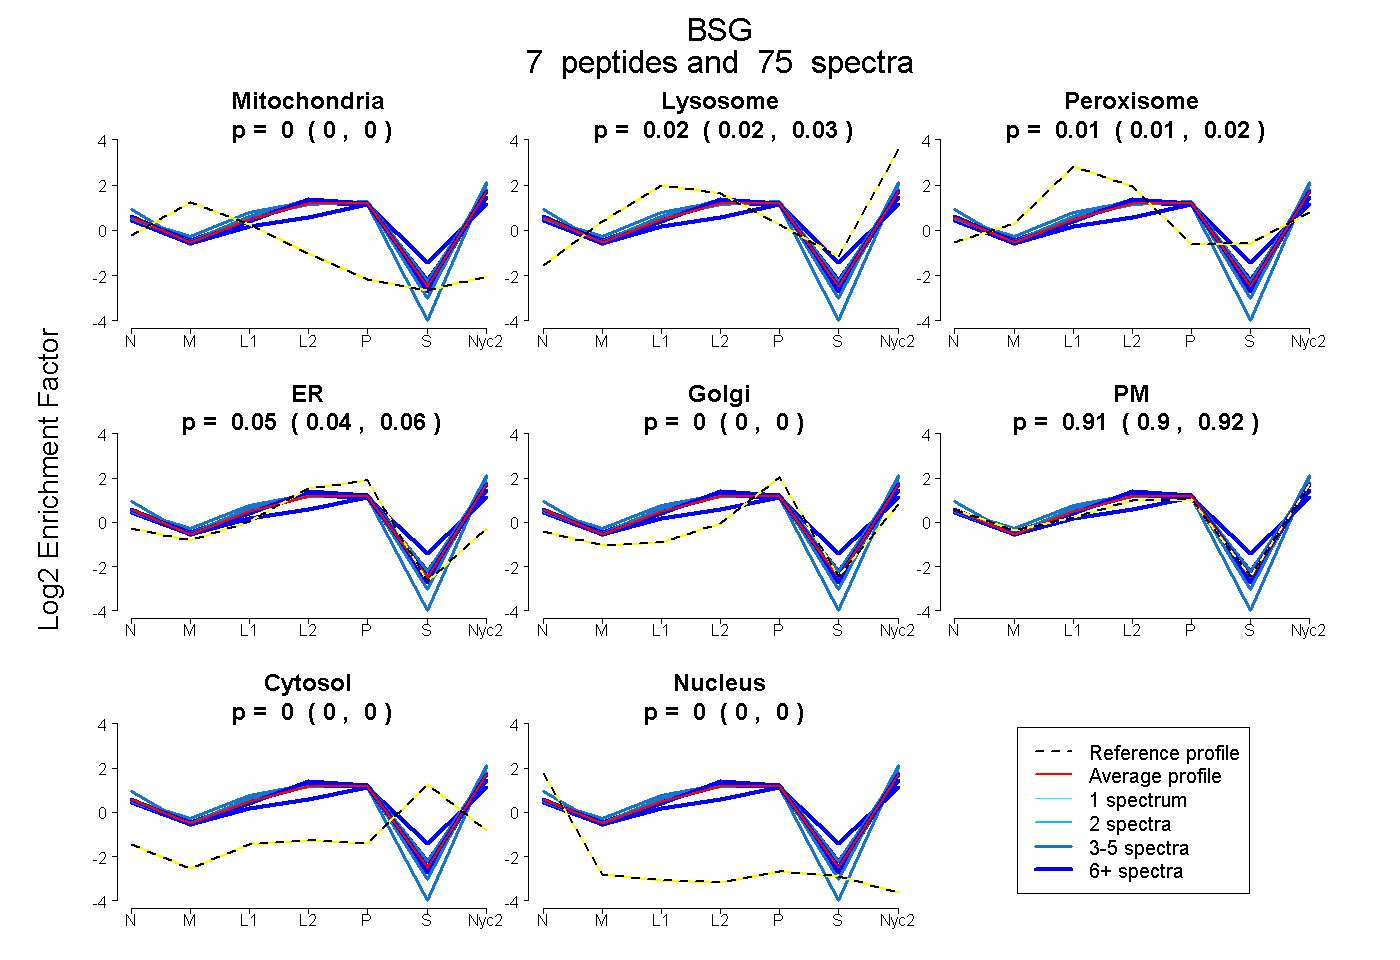
| Expt A |
7 peptides |
75 spectra |
|
0.000 0.000 | 0.000 |
0.023 0.016 | 0.029 |
0.014 0.006 | 0.022 |
0.051 0.044 | 0.058 |
0.000 0.000 | 0.000 |
0.911 0.902 | 0.919 |
0.000 0.000 | 0.000 |
0.000 0.000 | 0.000 |
| 8 spectra, SGEYSCIFLPEPVGR | 0.000 | 0.000 | 0.088 | 0.112 | 0.000 | 0.801 | 0.000 | 0.000 | ||
| 5 spectra, VLQEDTLPDLQMK | 0.000 | 0.074 | 0.025 | 0.051 | 0.000 | 0.850 | 0.000 | 0.000 | ||
| 7 spectra, SEHASEGEFVK | 0.000 | 0.000 | 0.098 | 0.000 | 0.158 | 0.632 | 0.113 | 0.000 | ||
| 3 spectra, SEASHPPVDEWVWFK | 0.000 | 0.085 | 0.000 | 0.000 | 0.000 | 0.915 | 0.000 | 0.000 | ||
| 21 spectra, YTVDADDR | 0.000 | 0.039 | 0.000 | 0.073 | 0.000 | 0.888 | 0.000 | 0.000 | ||
| 27 spectra, GNINVEGPPR | 0.000 | 0.031 | 0.000 | 0.056 | 0.000 | 0.913 | 0.000 | 0.000 | ||
| 4 spectra, ETISLR | 0.000 | 0.000 | 0.000 | 0.000 | 0.000 | 1.000 | 0.000 | 0.000 |
| Plot | Mito | Lyso or Perox | ER | Golgi | PM | Cytosol | Nucleus | ||||||
| Expt B |
6 peptides |
19 spectra |
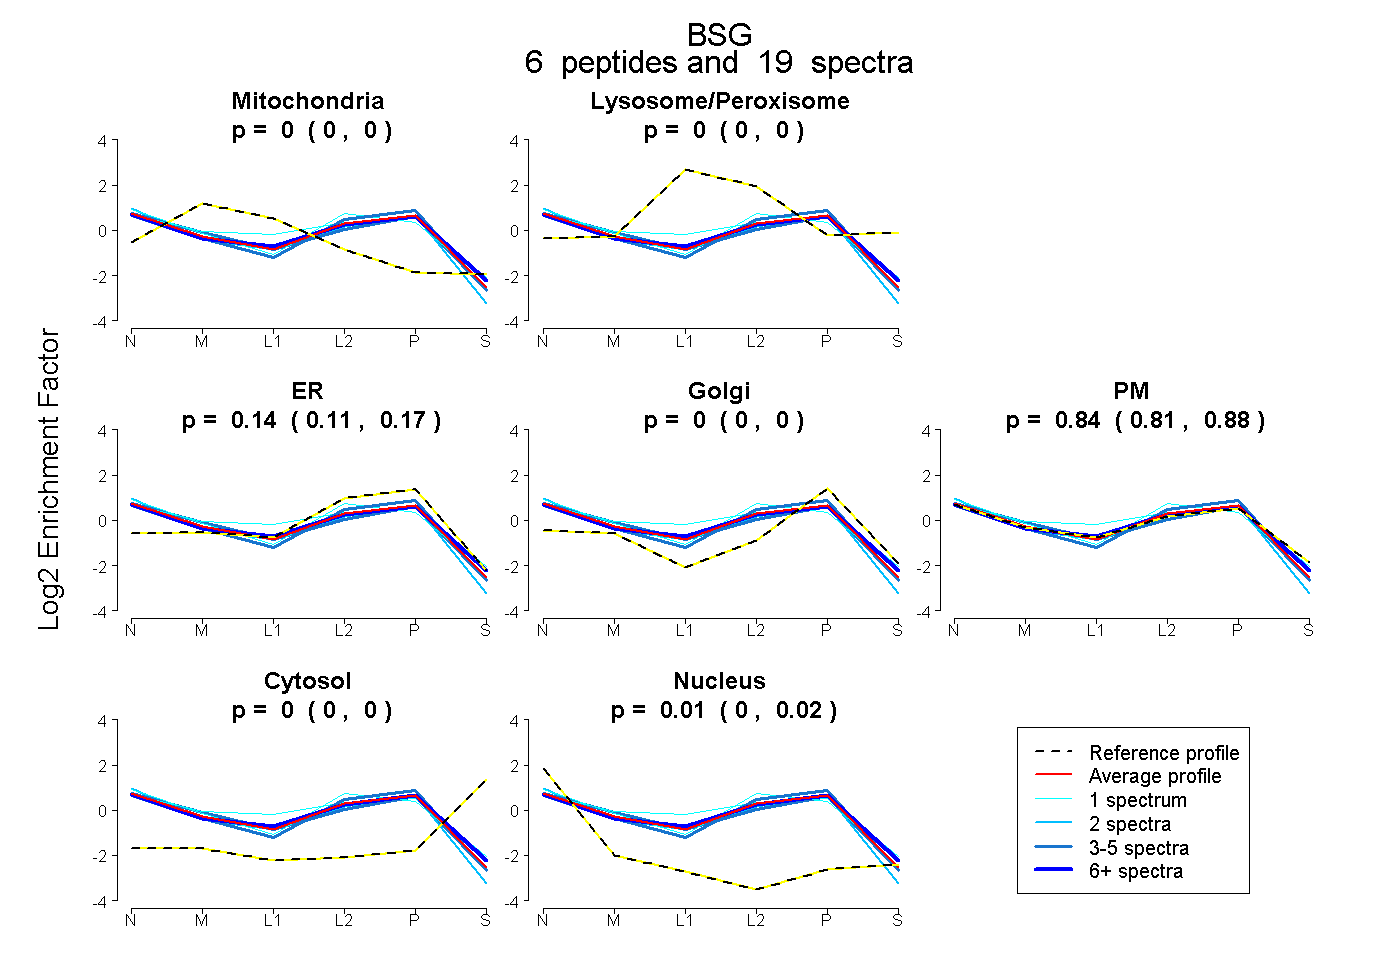 |
0.000 0.000 | 0.000 |
0.000 0.000 | 0.000 |
0.143 0.114 | 0.168 |
0.000 0.000 | 0.000 |
0.844 0.808 | 0.877 |
0.000 0.000 | 0.000 |
0.012 0.002 | 0.021 |
|||
| Plot | Lyso | Other | |||||||||||
| Expt C |
8 peptides |
143 spectra |
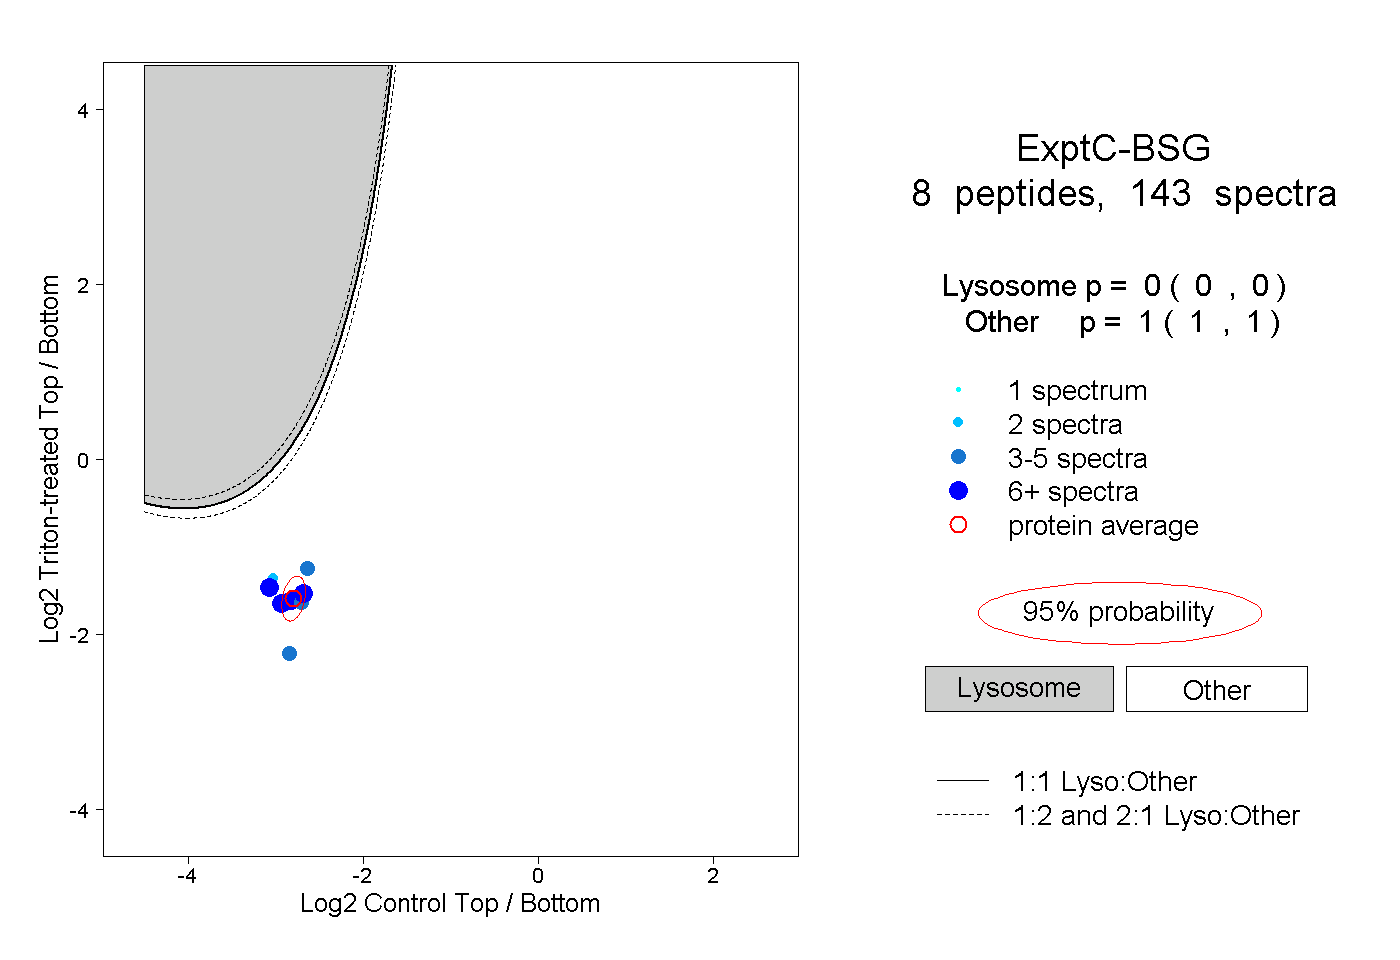 |
0.000 0.000 | 0.000 |
1.000 1.000 | 1.000 |
||||||||
| Plot | Lyso | Other | |||||||||||
| Expt D |
4 peptides |
12 spectra |
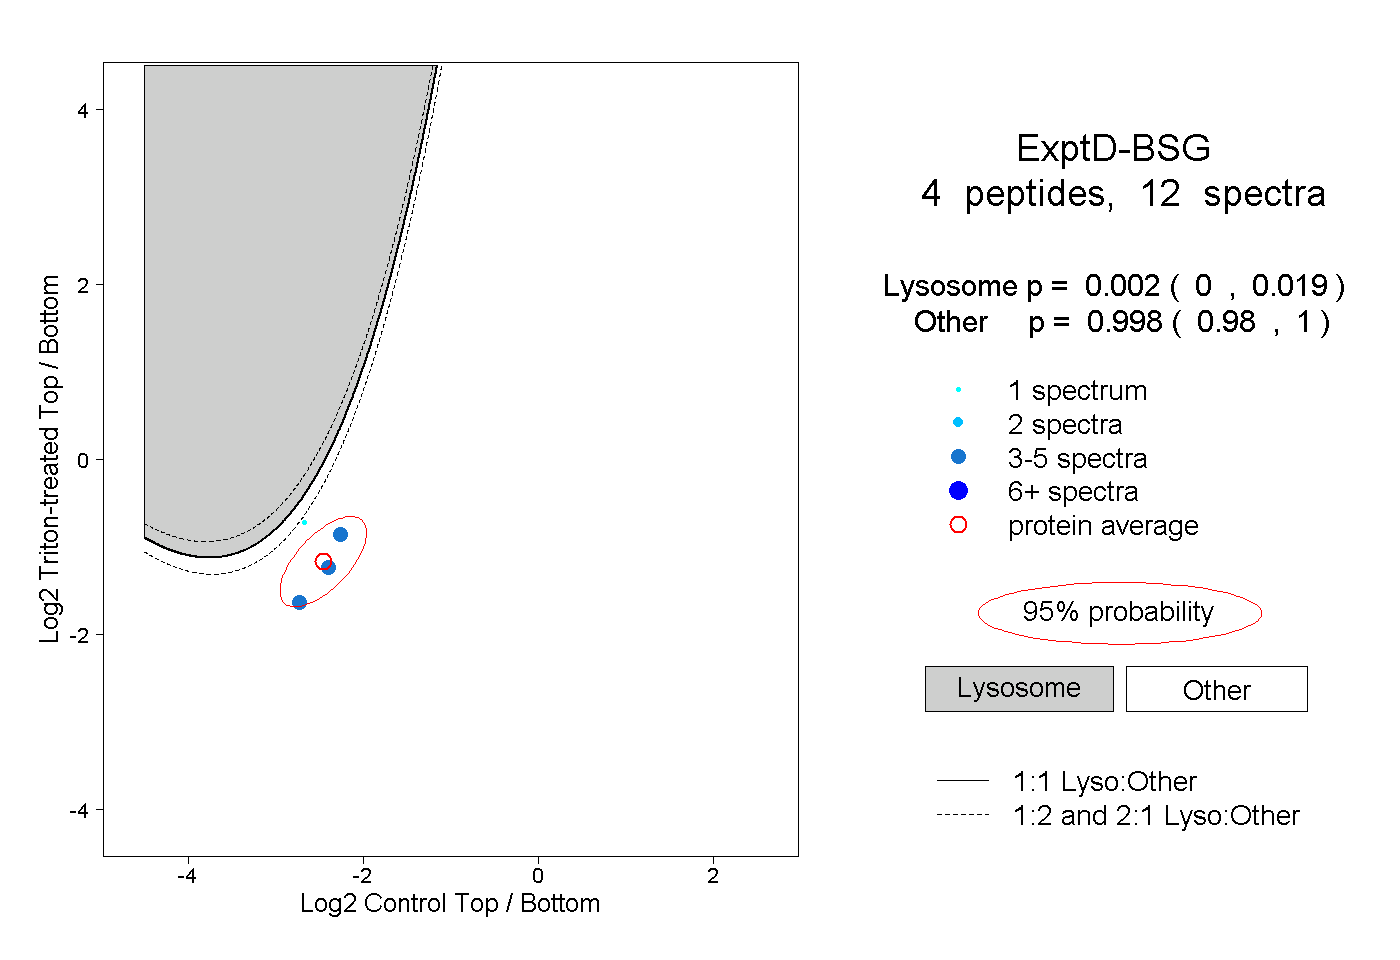 |
0.002 0.000 | 0.019 |
0.998 0.980 | 1.000 |