 8
8peptides
spectra
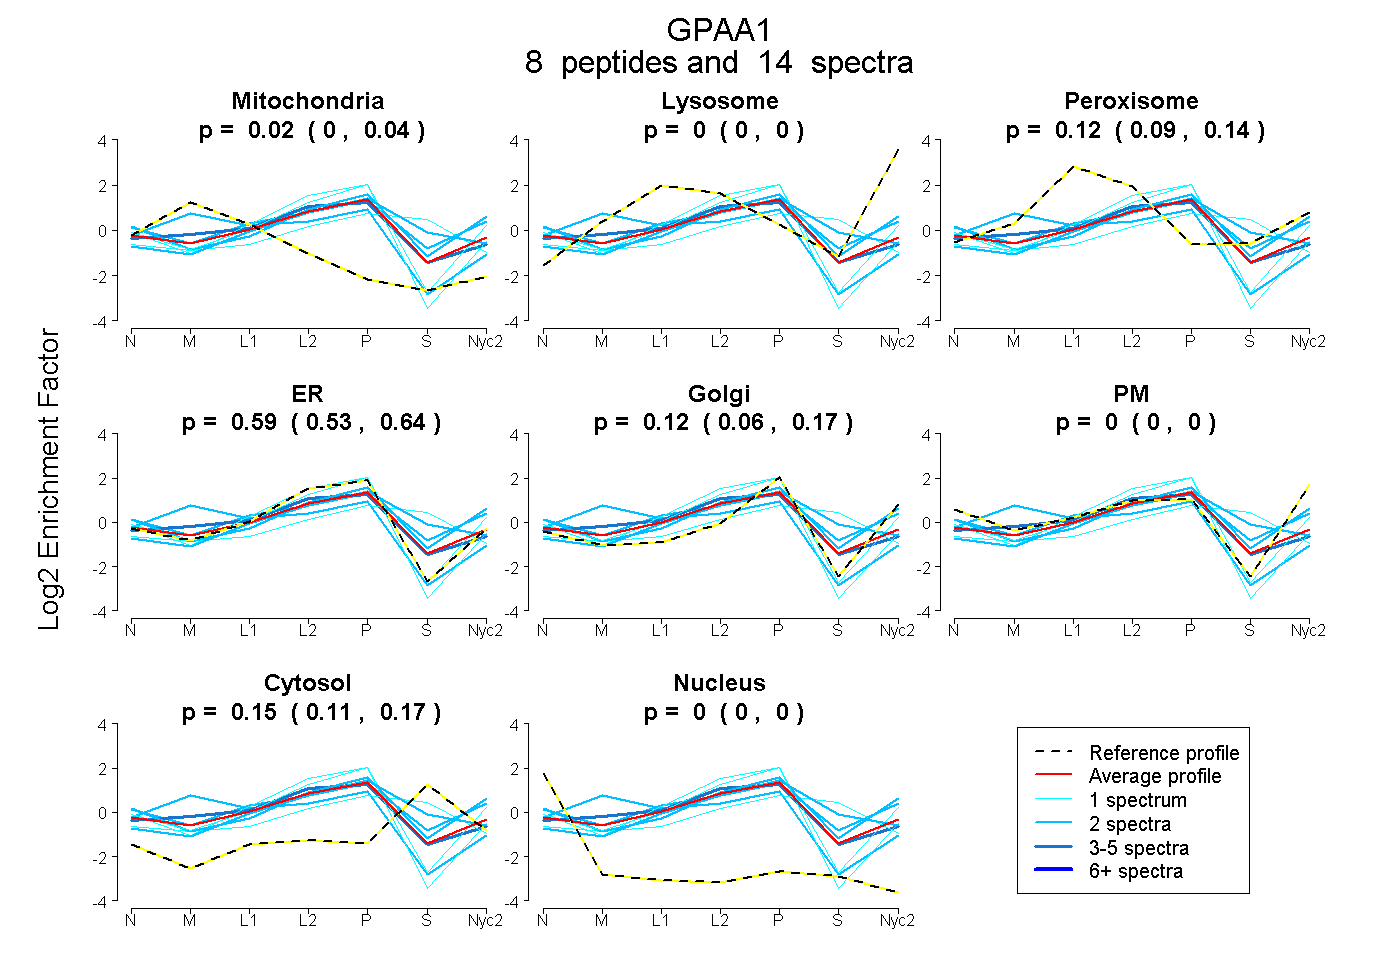
0.000 | 0.044
0.000 | 0.000
0.090 | 0.144
0.528 | 0.645
0.056 | 0.172
0.000 | 0.000
0.114 | 0.174
0.000 | 0.000
1peptide
spectrum
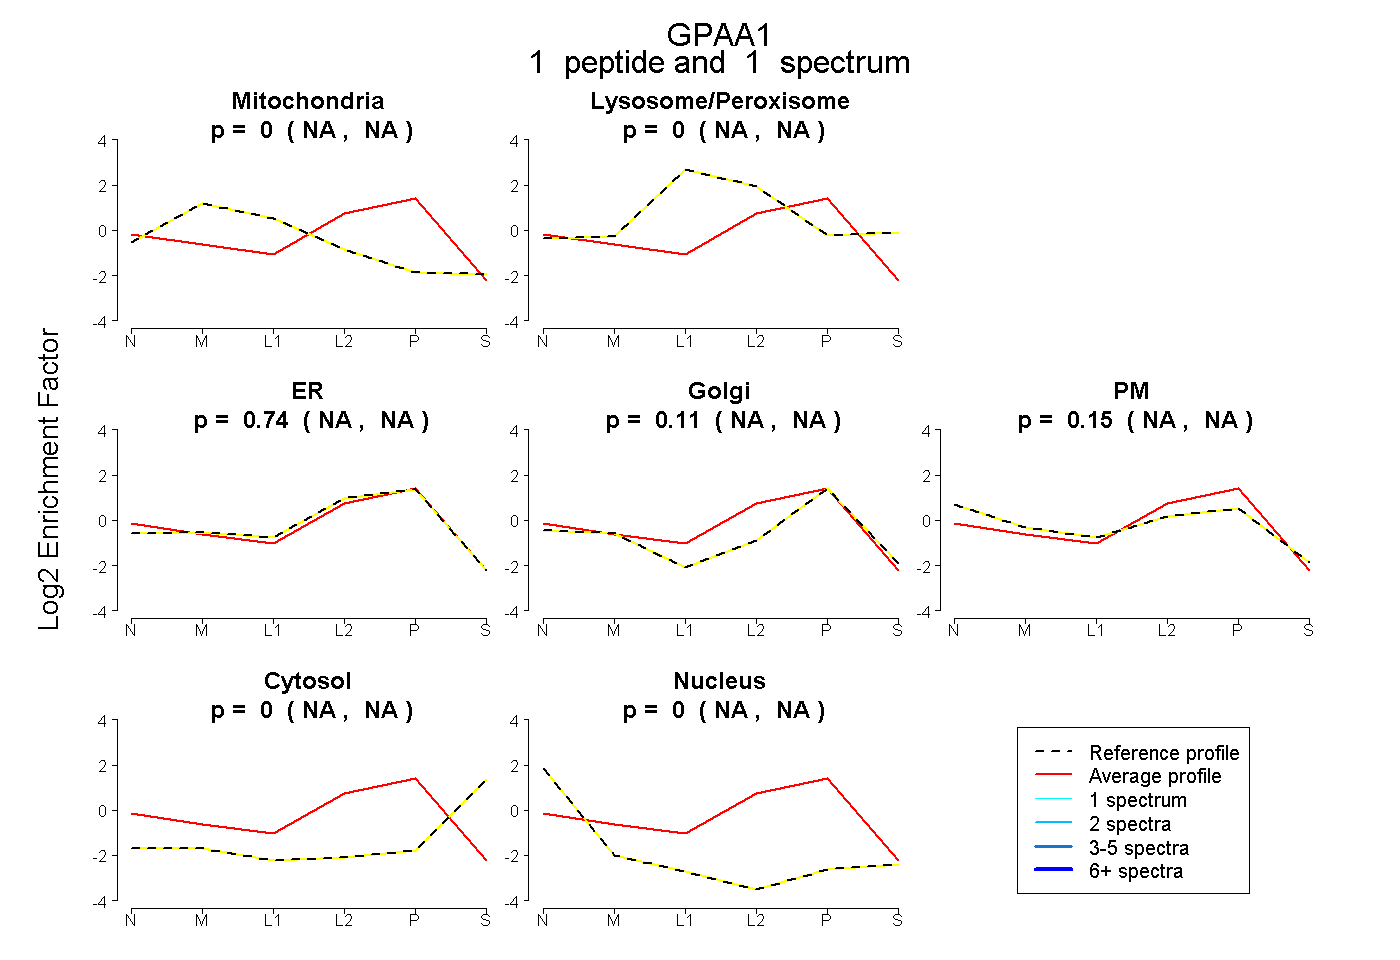
NA | NA
NA | NA
NA | NA
NA | NA
NA | NA
NA | NA
NA | NA
4peptides
spectra
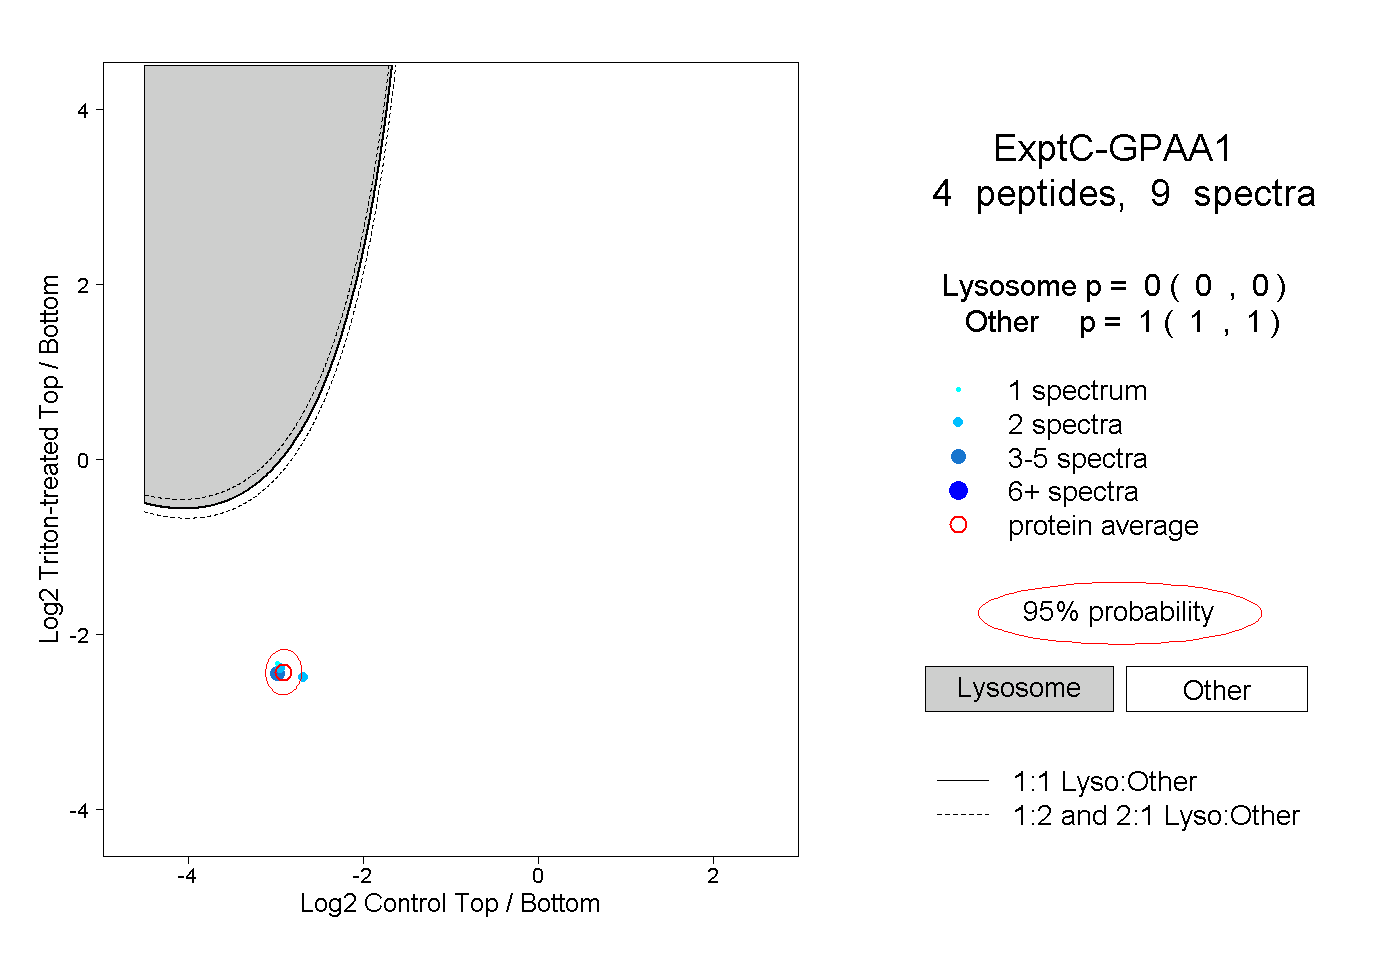
0.000 | 0.000
1.000 | 1.000