14
14peptides
spectra
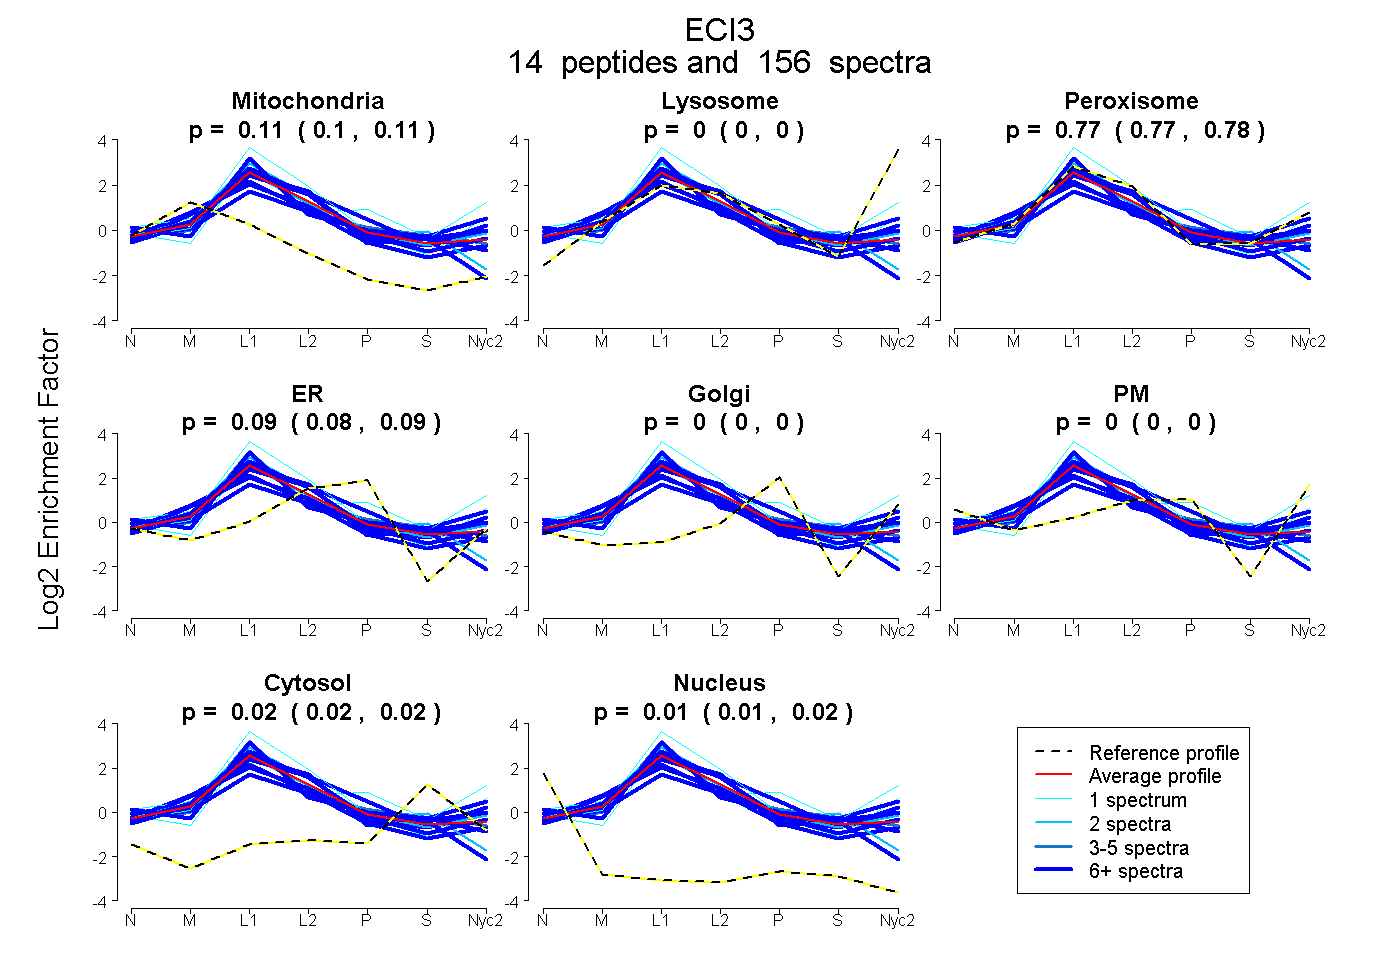
0.100 | 0.111
0.000 | 0.000
0.768 | 0.781
0.082 | 0.090
0.000 | 0.000
0.000 | 0.000
0.016 | 0.023
0.009 | 0.016
9peptides
spectra
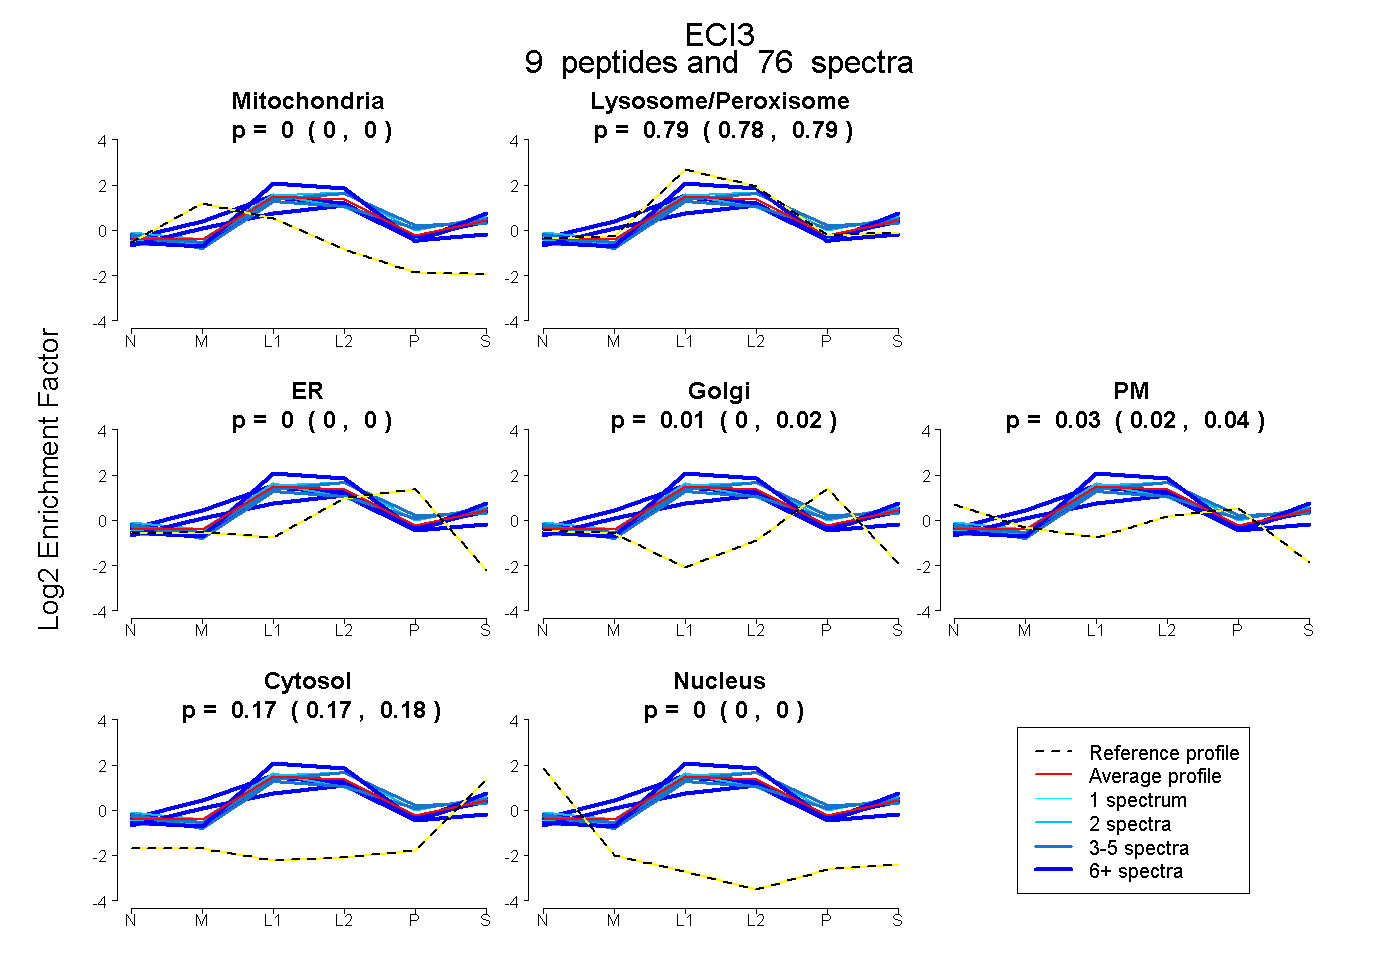
0.000 | 0.000
0.781 | 0.794
0.000 | 0.004
0.000 | 0.021
0.016 | 0.040
0.166 | 0.175
0.000 | 0.000