 1
1peptide
spectrum
NA | NA
NA | NA
NA | NA
NA | NA
NA | NA
NA | NA
NA | NA
NA | NA
2peptides
spectra
0.000 | 0.977
0.022 | 1.000
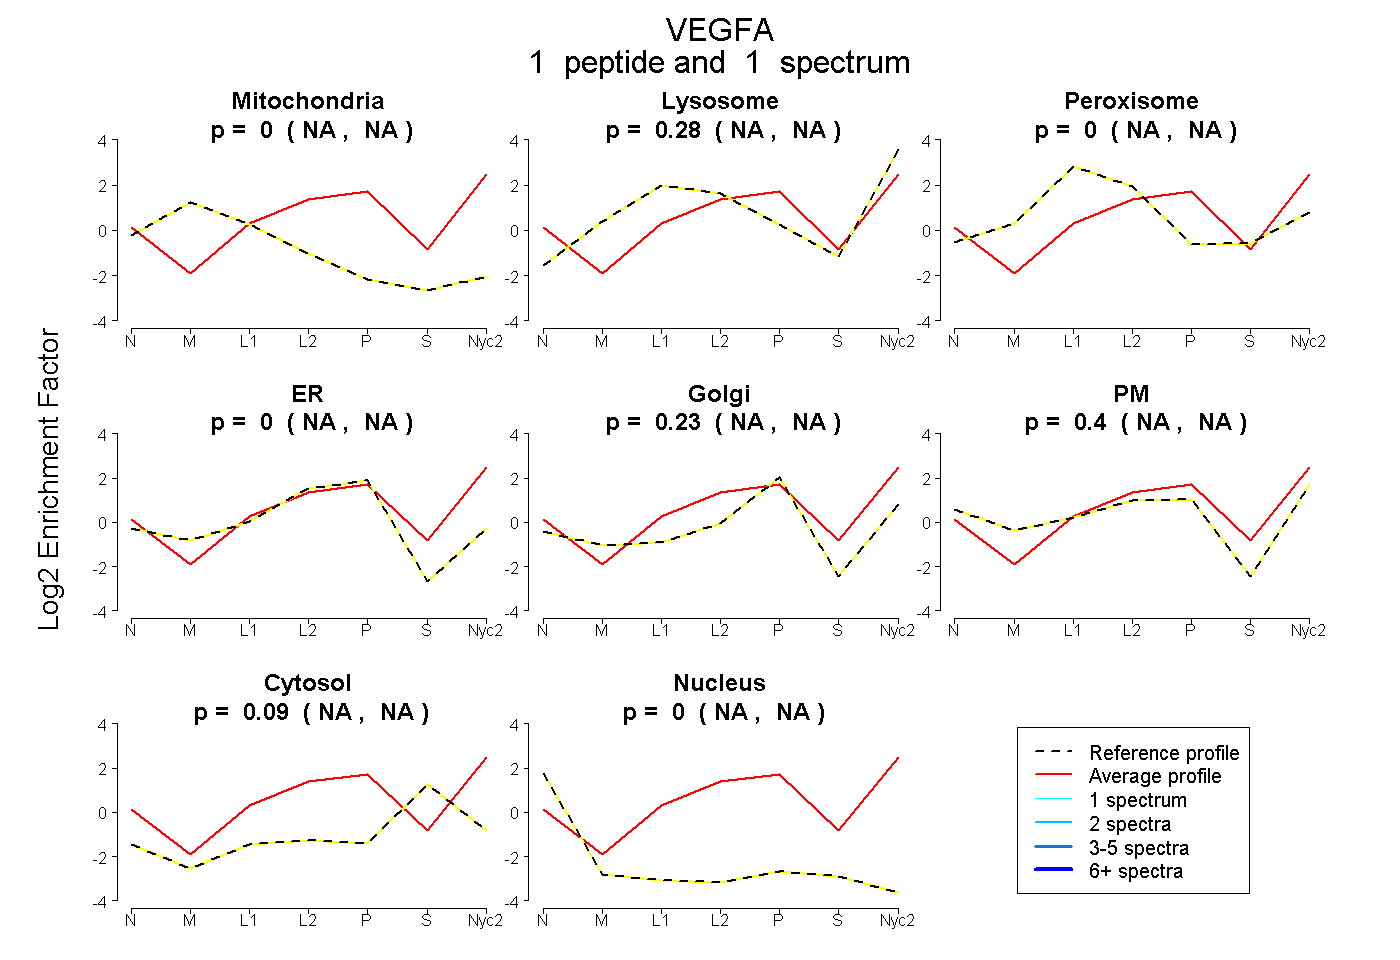
| Plot | Mito | Lyso | Perox | ER | Golgi | PM | Cytosol | Nucleus | |||||
| Expt A |
1 peptide |
1 spectrum |
|
0.000 NA | NA |
0.278 NA | NA |
0.000 NA | NA |
0.000 NA | NA |
0.229 NA | NA |
0.402 NA | NA |
0.091 NA | NA |
0.000 NA | NA |
||
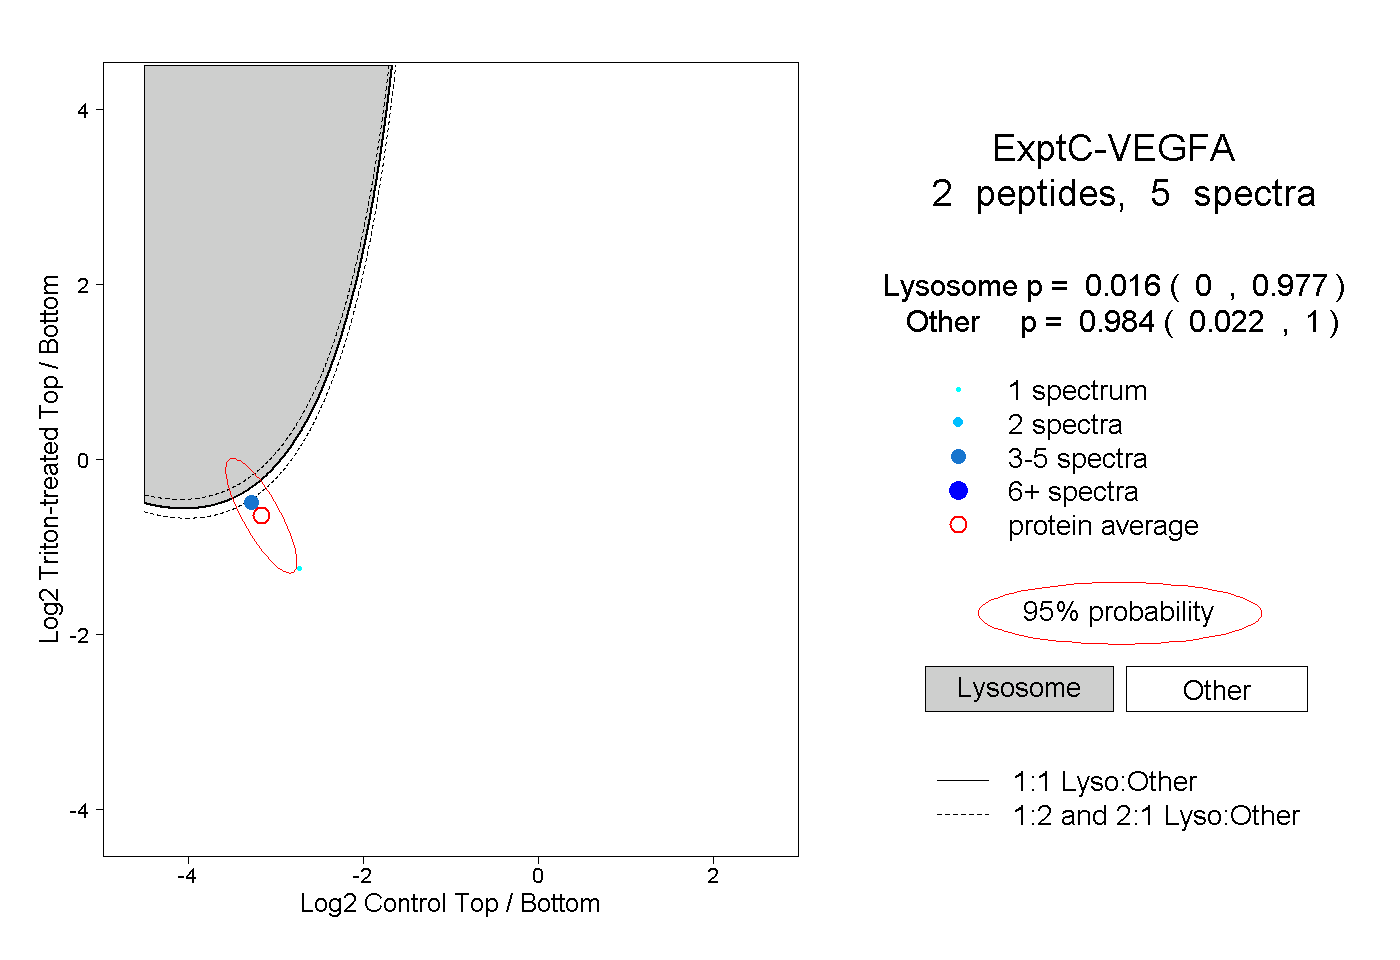
| Plot | Lyso | Other | |||||||||||
| Expt C |
2 peptides |
5 spectra |
|
0.016 0.000 | 0.977 |
0.984 0.022 | 1.000 |