 3
3peptides
spectra
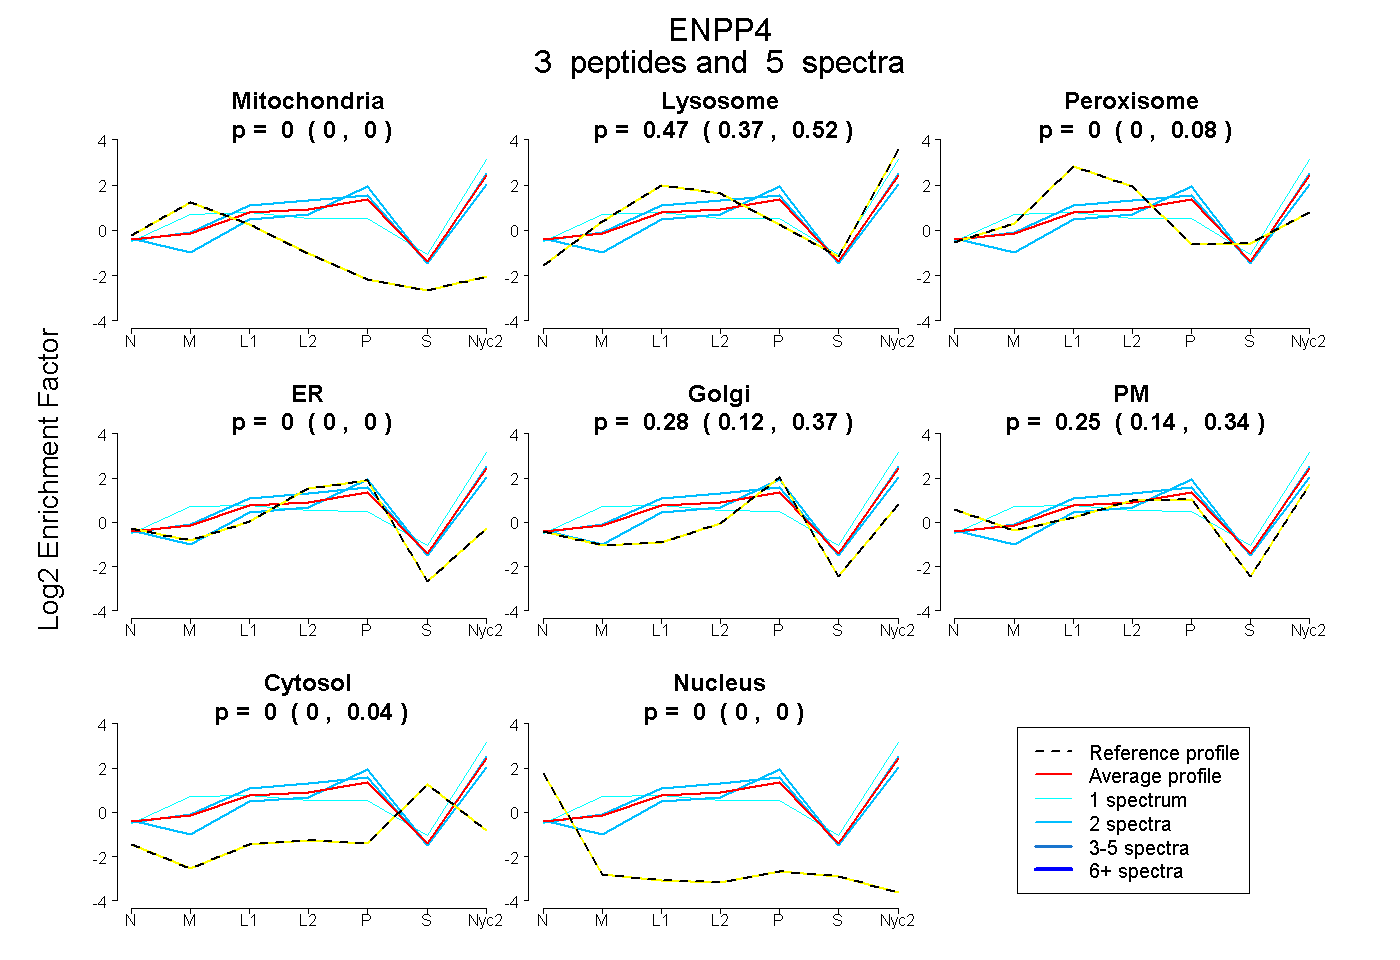
0.000 | 0.000
0.367 | 0.521
0.000 | 0.082
0.000 | 0.004
0.124 | 0.373
0.140 | 0.344
0.000 | 0.043
0.000 | 0.000
2peptides
spectra
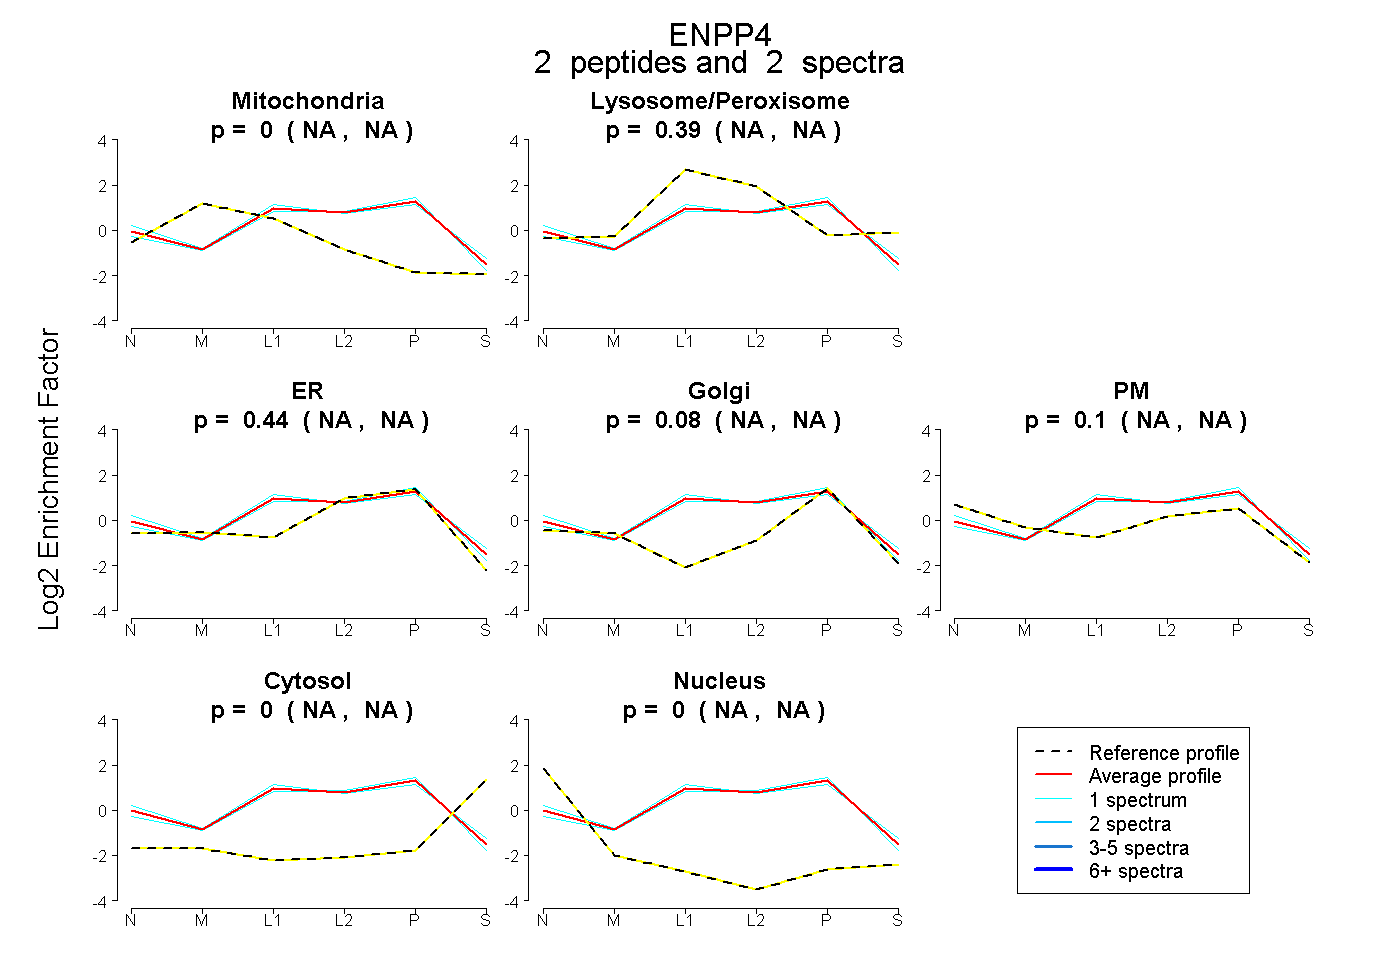
NA | NA
NA | NA
NA | NA
NA | NA
NA | NA
NA | NA
NA | NA
9peptides
spectra
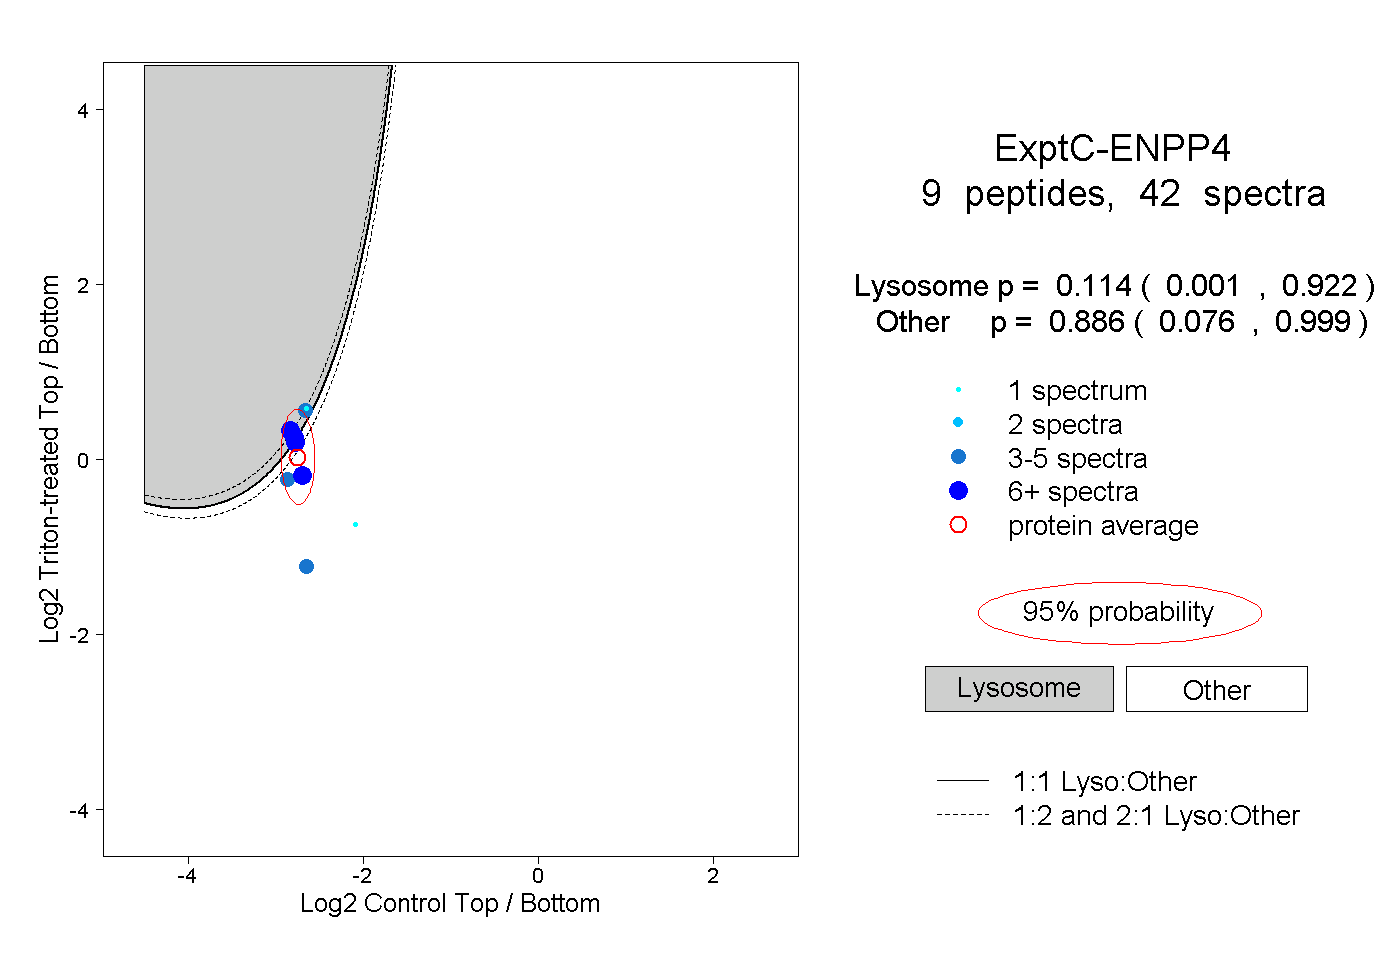
0.001 | 0.922
0.076 | 0.999
4peptides
spectra
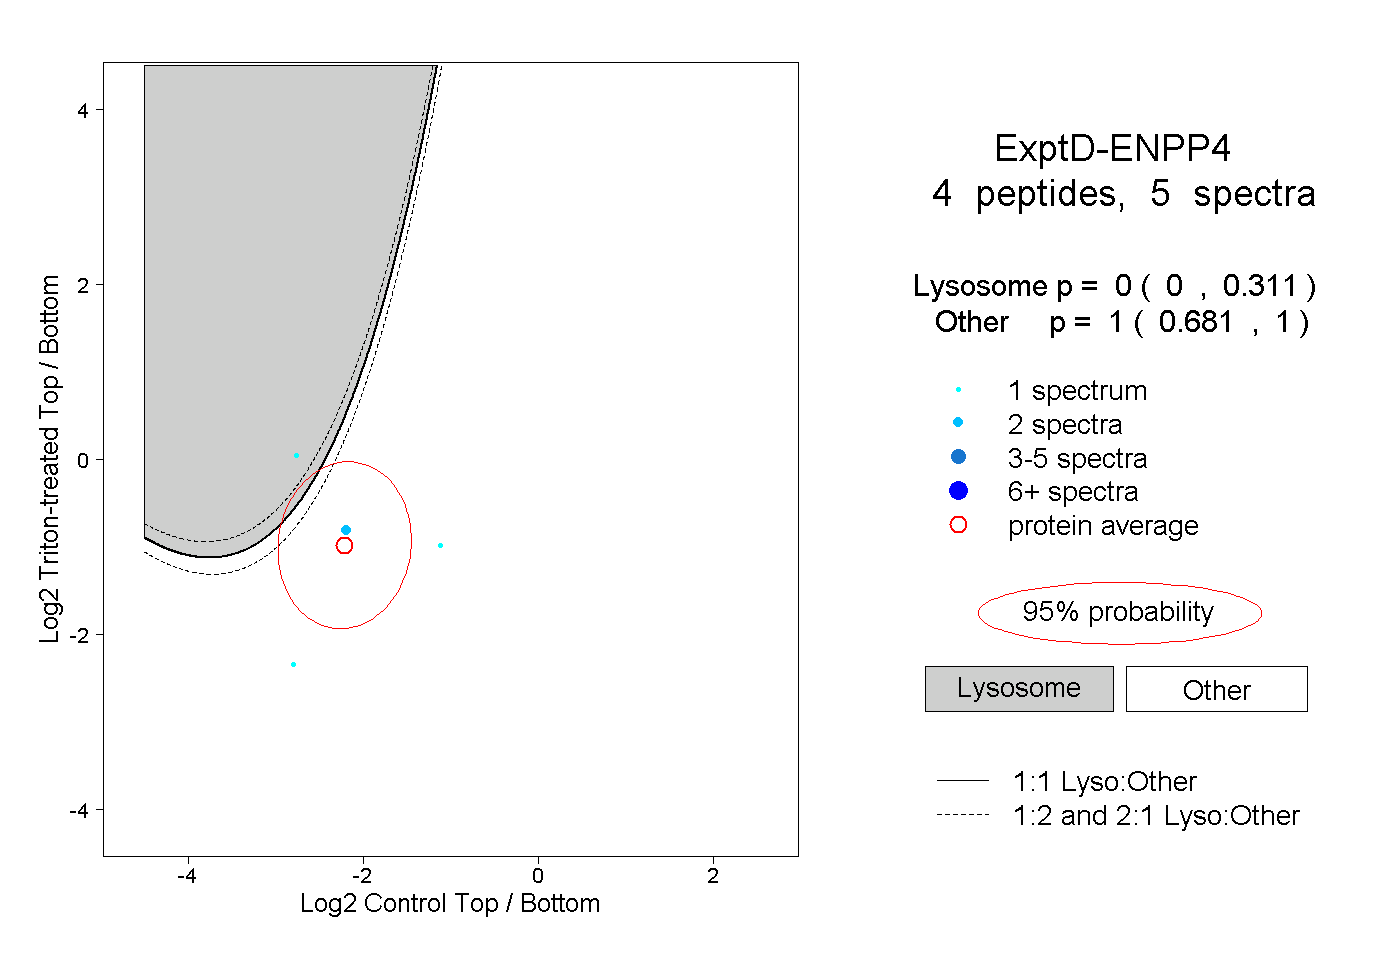
0.000 | 0.311
0.681 | 1.000