 3
3peptides
spectra
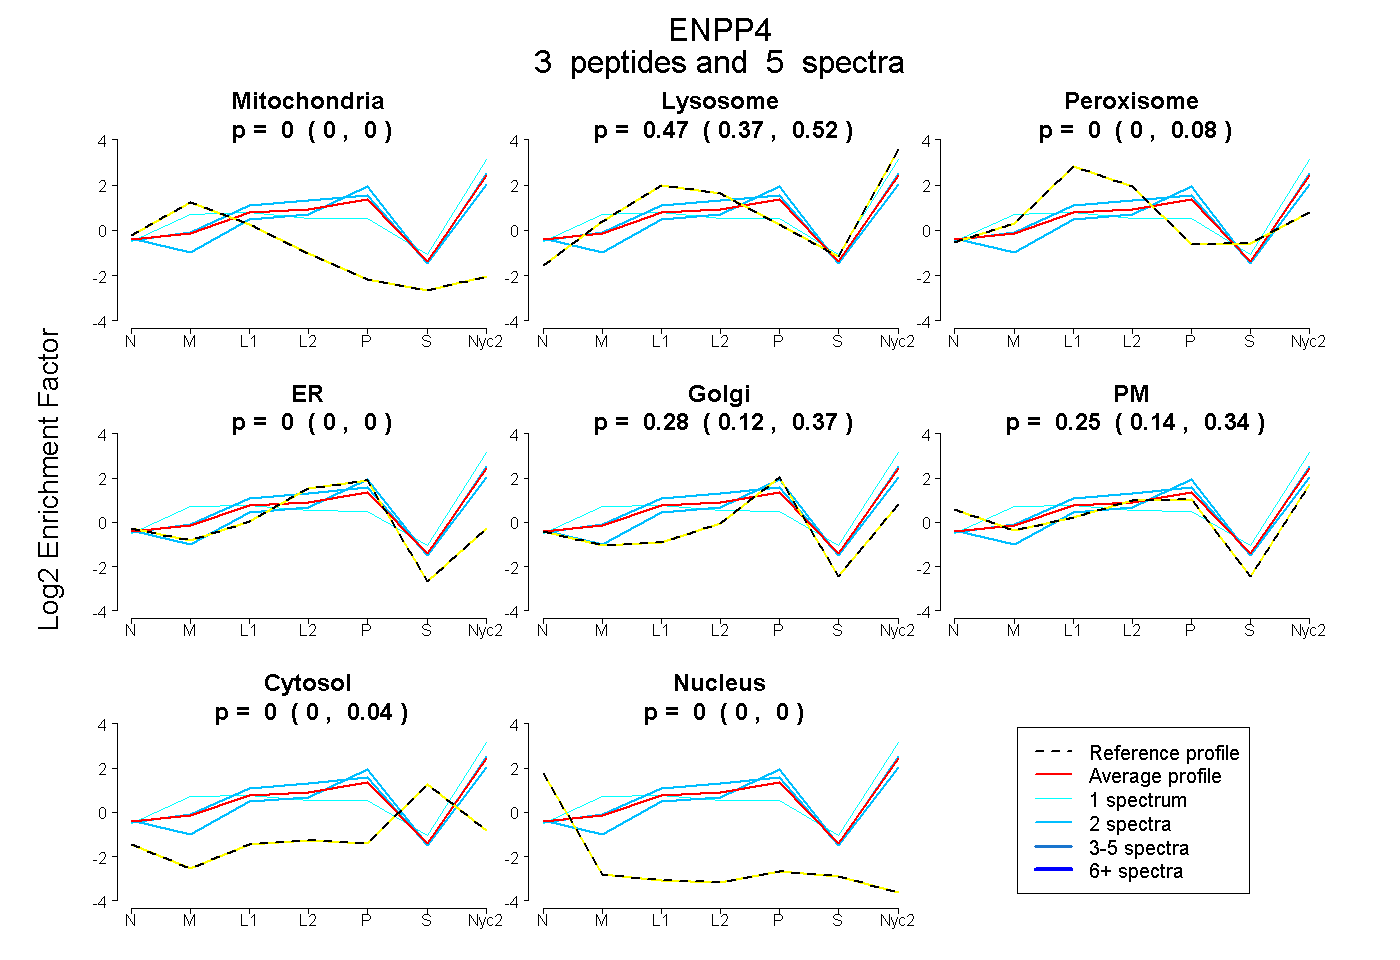
0.000 | 0.000
0.367 | 0.521
0.000 | 0.082
0.000 | 0.004
0.124 | 0.373
0.140 | 0.344
0.000 | 0.043
0.000 | 0.000
| Plot | Mito | Lyso | Perox | ER | Golgi | PM | Cytosol | Nucleus | |||||
| Expt A |
3 peptides |
5 spectra |
|
0.000 0.000 | 0.000 |
0.469 0.367 | 0.521 |
0.000 0.000 | 0.082 |
0.000 0.000 | 0.004 |
0.284 0.124 | 0.373 |
0.247 0.140 | 0.344 |
0.000 0.000 | 0.043 |
0.000 0.000 | 0.000 |
| 2 spectra, EVDGLIGDLVQK | 0.000 | 0.395 | 0.000 | 0.000 | 0.525 | 0.080 | 0.000 | 0.000 | ||
| 2 spectra, ASASRPFSR | 0.000 | 0.455 | 0.014 | 0.245 | 0.099 | 0.188 | 0.000 | 0.000 | ||
| 1 spectrum, ADYLNNYDLPHLQNFIK | 0.014 | 0.617 | 0.000 | 0.000 | 0.022 | 0.296 | 0.051 | 0.000 |
| Plot | Mito | Lyso or Perox | ER | Golgi | PM | Cytosol | Nucleus | ||||||
| Expt B |
2 peptides |
2 spectra |
 |
0.000 NA | NA |
0.389 NA | NA |
0.437 NA | NA |
0.076 NA | NA |
0.098 NA | NA |
0.000 NA | NA |
0.000 NA | NA |
|||
| Plot | Lyso | Other | |||||||||||
| Expt C |
9 peptides |
42 spectra |
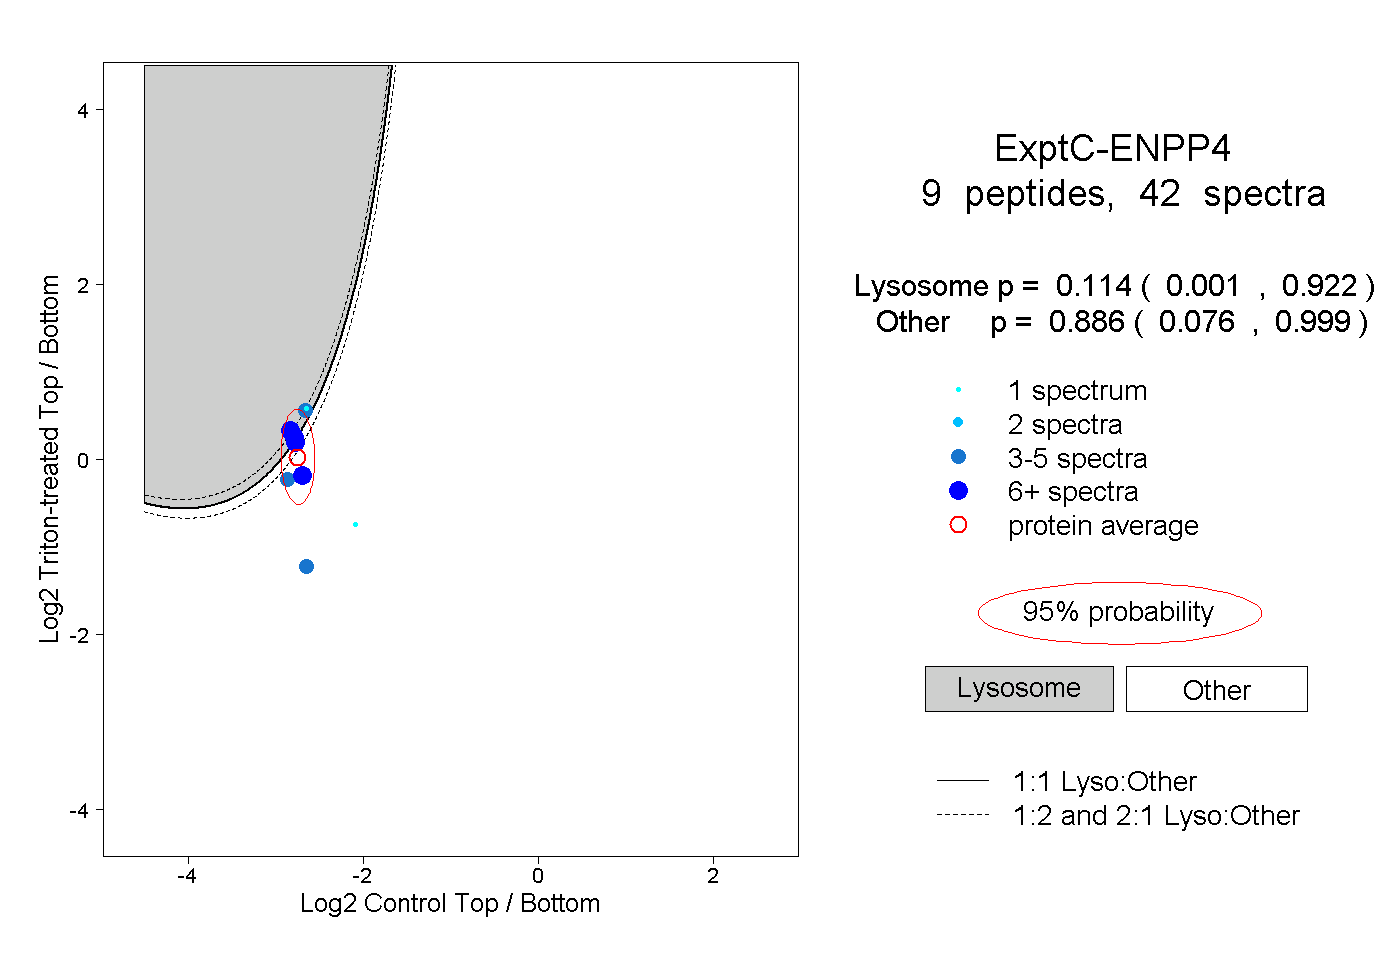 |
0.114 0.001 | 0.922 |
0.886 0.076 | 0.999 |
||||||||
| Plot | Lyso | Other | |||||||||||
| Expt D |
4 peptides |
5 spectra |
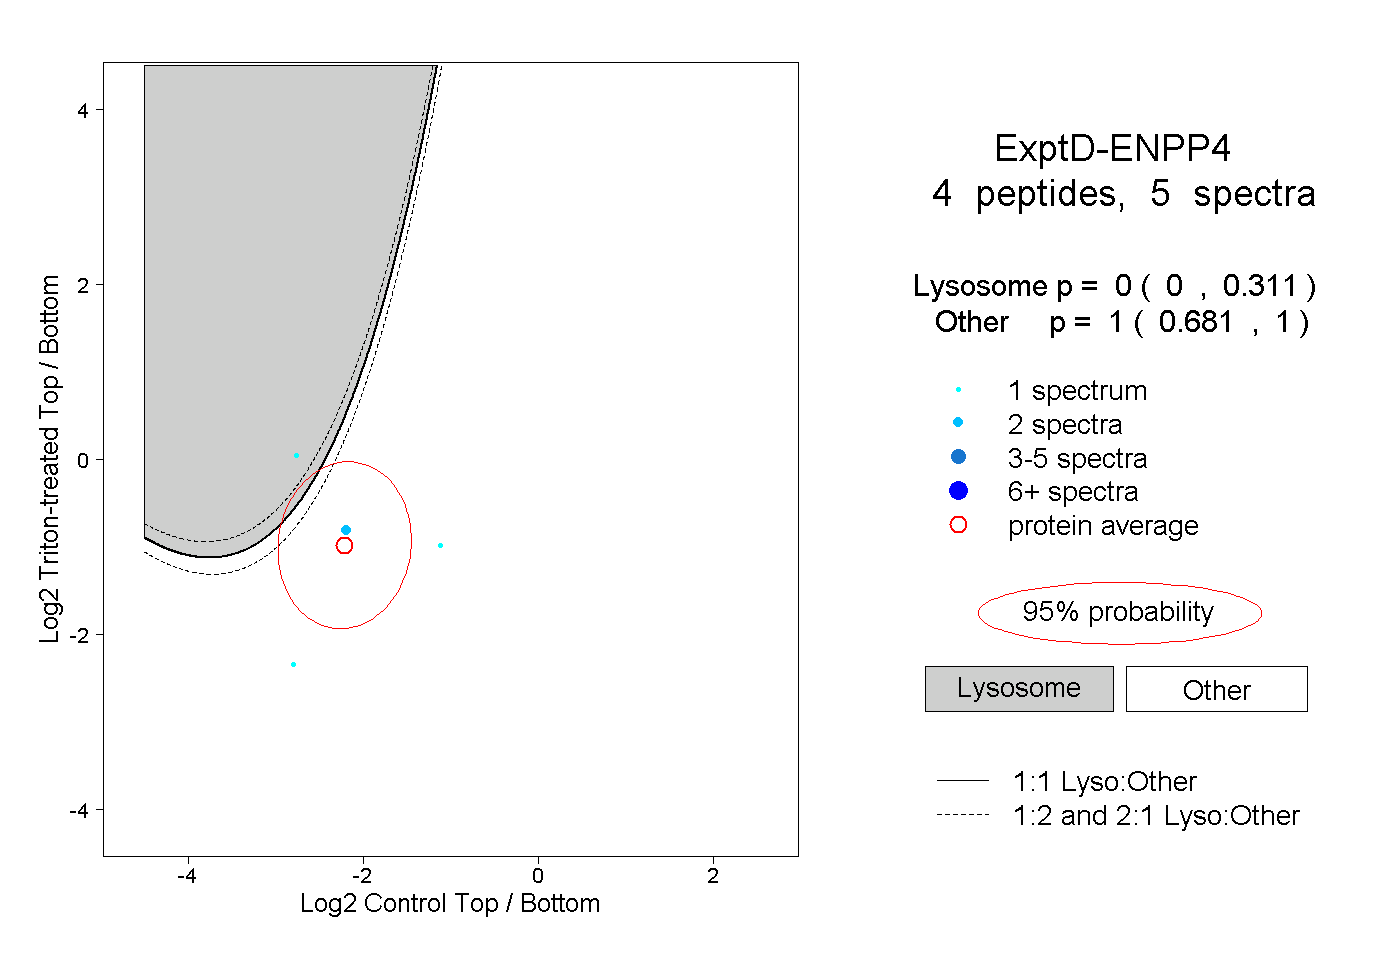 |
0.000 0.000 | 0.311 |
1.000 0.681 | 1.000 |